. 2007 Apr 27;3(4):e76.
doi: 10.1371/journal.pcbi.0030076. Epub 2007 Mar 8.

Patterns of mesenchymal condensation in a multiscale, discrete stochastic model

Affiliations

Patterns of mesenchymal condensation in a multiscale, discrete stochastic model

Scott Christley et al. PLoS Comput Biol. .

Abstract

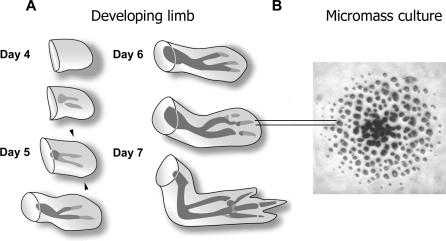
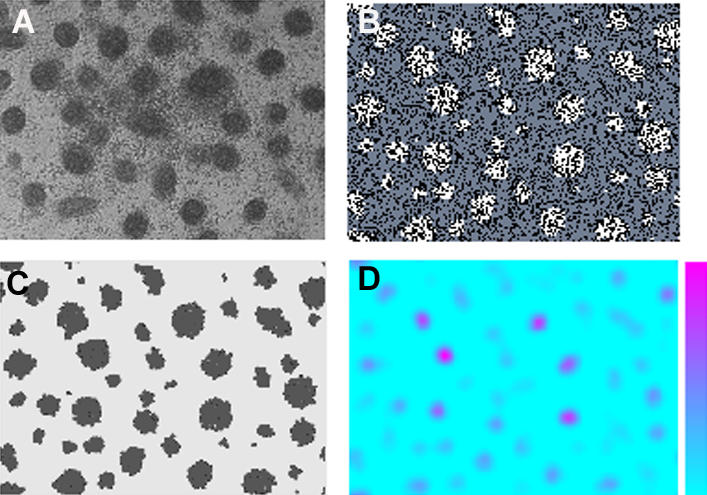
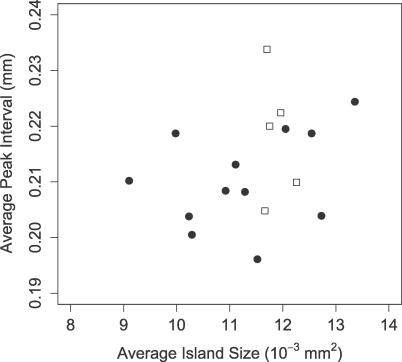
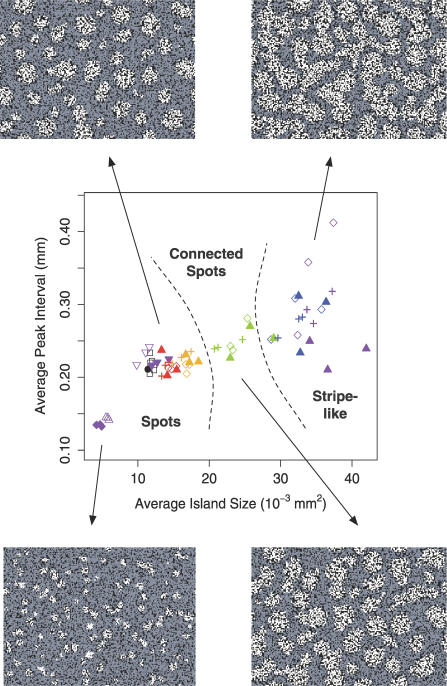
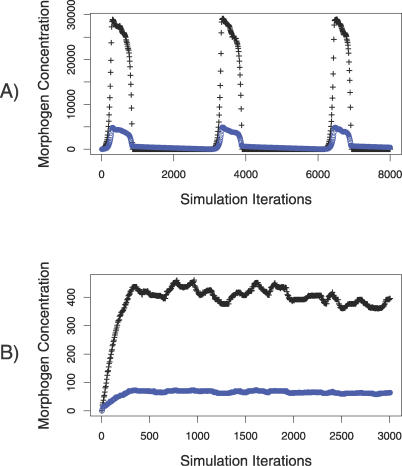
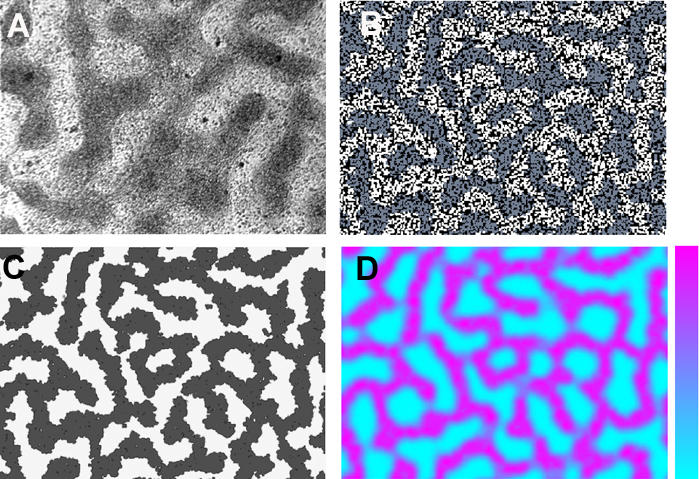
Cells of the embryonic vertebrate limb in high-density culture undergo chondrogenic pattern formation, which results in the production of regularly spaced "islands" of cartilage similar to the cartilage primordia of the developing limb skeleton. The first step in this process, in vitro and in vivo, is the generation of "cell condensations," in which the precartilage cells become more tightly packed at the sites at which cartilage will form. In this paper we describe a discrete, stochastic model for the behavior of limb bud precartilage mesenchymal cells in vitro. The model uses a biologically motivated reaction-diffusion process and cell-matrix adhesion (haptotaxis) as the bases of chondrogenic pattern formation, whereby the biochemically distinct condensing cells, as well as the size, number, and arrangement of the multicellular condensations, are generated in a self-organizing fashion. Improving on an earlier lattice-gas representation of the same process, it is multiscale (i.e., cell and molecular dynamics occur on distinct scales), and the cells are represented as spatially extended objects that can change their shape. The authors calibrate the model using experimental data and study sensitivity to changes in key parameters. The simulations have disclosed two distinct dynamic regimes for pattern self-organization involving transient or stationary inductive patterns of morphogens. The authors discuss these modes of pattern formation in relation to available experimental evidence for the in vitro system, as well as their implications for understanding limb skeletal patterning during embryonic development.


Conflict of interest statement

Competing interests. The authors have declared that no competing interests exist.

Figures

Figure 1
Figure 1. Developing Limb and Micromass Culture
(A) Progress of limb skeletal development in chicken forelimb (wing) between 3 and 7 d of embryogenesis. Gray represents precartilage condensation, and black represents definitive cartilage. The developing limb, or limb bud, is paddle-shaped, being flatter in the back-to-front (dorsoventral) dimension than in the thumb-to-little finger (anteroposterior) dimension, or the shoulder-to-fingertips (proximodistal) direction in which it mainly grows. The cartilages that prefigure the bones first arise as stripe-like (e.g., long bones, digits) or spot-like (e.g., wrist bones shown here, or ankle bones in the hindlimb) mesenchymal condensations. The apical zone of the 5-d chicken wing bud (indicated by the arrowheads) or leg bud provide a source of not-yet-condensed mesenchymal cells that when grown in high-density “micromass” culture will form precartilage condensations. (B) Discrete spot-like cartilage nodules that have formed after 6 d in a micromass culture of 5-d leg bud apical zone limb mesenchymal cells, visualized by staining with Alcian blue. The cells in these cultures are initially plated as a densely packed monolayer (“micromass”) and rearrange over short distances in the 2-D plane of the ∼3 mm diameter culture during the indicated period. Each nodule arises from a condensation containing approximately 30–50 cells. As indicated by the parallel lines, the spatial scale of the spot-like nodules (and the precartilage condensations from which they arise) in the micromass cultures is comparable to the diameter of the precartilage and cartilaginous skeletal primordia in the developing limb. The left panel is adapted, with changes, from [54]; the right panel is courtesy of Dr. Sherry Downie.
Figure 2
Figure 2. Multipixel Spatial Representation of Cells
(A) Three cells on the spatial grid each occupying seven pixels. (B) Cell changes shape. The region of the cell that contains the nucleus, indicated by the four gray pixels, is structurally maintained; two border pixels move to new locations, and one border pixel (top right) displaces a nucleus pixel, which gets shifted to the right. (C) Cell rounding-up on fibronectin. The surface area in the presence of suprathreshold amounts of fibronectin is reduced with two border pixels moving into a quasi-third dimension above the cell.
Figure 3
Figure 3. In Vitro and Oscillatory Regime Simulation Images for Spot-Like Precartilage Condensations
(A) Discrete spot-like precartilage condensations that have formed after 72 h in a micromass culture of 5-d leg bud apical zone limb mesenchymal cells, visualized by Hoffman Contrast Modulation optics. Actual size of the microscopic field is 1 × 1.4 mm, and each condensation contains approximately 30–50 tightly packed cells. (B) Spatial grid of equal physical size to (A) containing over 6,000 cells produced by simulation using the parameter values in Table 2 showing clusters of fibronectin-producing differentiated cells (white), nondifferentiated cells (blue-gray), and empty space between cells (black). Each cluster contains on average ∼30 cells. (C) Spatial grid of same simulation as (B) showing fibronectin-rich patches (black) produced by the differentiated cells. (D) Spatial grid of same simulation as (B) showing activator concentrations at time slightly after the initial onset of cell differentiation. The color bar indicates the range, with magenta for high concentration and light blue for low concentration.
Figure 4
Figure 4. Average Peak Interval versus Average Island Size for Oscillatory Regime
Averages are shown for 12 experimental (circle) and five simulation (square) points using parameter values in Table 2 with different random initial conditions. All simulations were run for 3,000 iterations with periodic boundary conditions.
Figure 5
Figure 5. Variation in Some of the Key Parameters Induces Morphological Changes in the Resultant Spatial Patterns from Distinct Spots to Connected Spots to Stripe-Like Patterns
Average peak interval versus average island size for variations in the some of the key parameters are shown: +5% (diamond) and −5% (filled diamond) for k1, +5% (triangle) and −5% (filled triangle) for k3, +5% (inverted triangle) and −5% (filled inverted triangle) for k2, and +5% (+) for k4. The colored points are a gradient of variations: 1% (red), 2% (orange), 3% (green), 4% (blue), and 5% (violet). Also shown are the five simulations (square) using the standard parameter values in Table 2 and the mean for the 12 experiments (circle). All simulations were run for 3,000 iterations with periodic boundary conditions.
Figure 6
Figure 6. Dynamics of Oscillatory and Stationary Regimes
(A) Oscillatory regime produces transient patterns that repeat over time but are spatially stochastic. (B) Stationary regime produces stable patterns with minor stochastic fluctuations around an equilibrium concentration. Graphs show the maximum concentration value for a single pixel across the entire molecular grid (that pixel lies within an activator peak as in Figure 3D but may shift from peak to peak as concentrations vary) for activator (black) and inhibitor (blue) morphogens.
Figure 7
Figure 7. In Vitro and Simulation Images for Stripe-Like Precartilage Condensations
(A) Stripe-like precartilage condensations. (B) Spatial grid containing more than 6,000 cells produced by simulation showing stripes of fibronectin-producing differentiated cells (white), nondifferentiated cells (blue-gray), and empty space between cells (black). (C) Spatial grid of same simulation as (B) showing fibronectin-rich stripes (black) produced by the differentiated cells. (D) Spatial grid of same simulation as (B) showing activator concentrations at time slightly after the initial onset of cell differentiation. The color bar indicates the range, with magenta for high concentration and light blue for low concentration.

References

    1. Newman SA, Müller GB. Origination and innovation in the vertebrate limb skeleton: An epigenetic perspective. J Exp Zoolog B Mol Dev Evol. 2005;304:593–609. - PubMed
    1. Leonard CM, Fuld HM, Frenz DA, Downie SA, Massagué J, et al. Role of transforming growth factor-beta in chondrogenic pattern formation in the embryonic limb: Stimulation of mesenchymal condensation and fibronectin gene expression by exogenous TGF-β and evidence for endogenous TGF-β–like activity. Dev Biol. 1991;145:99–109. - PubMed
    1. Miura T, Shiota K. TGF β2 acts as an “activator” molecule in reaction–diffusion model and is involved in cell sorting phenomenon in mouse limb micromass culture. Dev Dyn. 2000;217:241–249. - PubMed
    1. Chimal-Monroy J, Rodriguez-Leon J, Montero JA, Gañan Y, Macias D, et al. Analysis of the molecular cascade responsible for mesodermal limb chondrogenesis: sox genes and BMP signaling. Dev Biol. 2003;257:292–301. - PubMed
    1. Downie SA, Newman SA. Different roles for fibronectin in the generation of fore and hind limb precartilage condensations. Dev Biol. 1995;172:519–530. - PubMed

Publication types