

Fundamental limits to position determination by concentration gradients
- PMID: 17465676
- PMCID: PMC1857820
- DOI: 10.1371/journal.pcbi.0030078
Fundamental limits to position determination by concentration gradients
Abstract
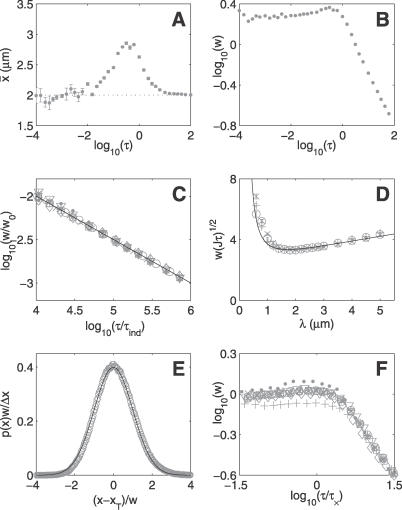
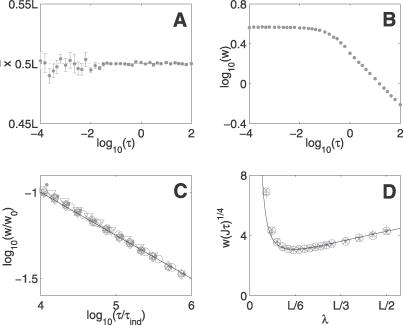
Position determination in biological systems is often achieved through protein concentration gradients. Measuring the local concentration of such a protein with a spatially varying distribution allows the measurement of position within the system. For these systems to work effectively, position determination must be robust to noise. Here, we calculate fundamental limits to the precision of position determination by concentration gradients due to unavoidable biochemical noise perturbing the gradients. We focus on gradient proteins with first-order reaction kinetics. Systems of this type have been experimentally characterised in both developmental and cell biology settings. For a single gradient we show that, through time-averaging, great precision potentially can be achieved even with very low protein copy numbers. As a second example, we investigate the ability of a system with oppositely directed gradients to find its centre. With this mechanism, positional precision close to the centre improves more slowly with increasing averaging time, and so longer averaging times or higher copy numbers are required for high precision. For both single and double gradients, we demonstrate the existence of optimal length scales for the gradients for which precision is maximized, as well as analyze how precision depends on the size of the concentration-measuring apparatus. These results provide fundamental constraints on the positional precision supplied by concentration gradients in various contexts, including both in developmental biology and also within a single cell.
Conflict of interest statement
Figures
References
-
- Wolpert L. Positional information and the spatial pattern of cellular differentiation. J Theor Biol. 1969;25:1–47. - PubMed
-
- Eldar A, Rosin D, Shilo BZ, Barkai N. Self-enhanced ligand degradation underlies robustness of morphogen gradients. Dev Cell. 2003;5:635–646. - PubMed
-
- Howard M, ten Wolde PR. Finding the centre reliably: Robust patterns of developmental gene expression. Phys Rev Lett. 2005;95:208103. - PubMed
-
- McHale P, Rappel WJ, Levine H. Embryonic pattern scaling achieved by oppositely directed morphogen gradients. Phys Biol. 2006;3:107–120. - PubMed
-
- Elowitz MB, Levine AJ, Siggia ED, Swain PS. Stochastic gene expression in a single cell. Science. 2002;297:1183–1186. - PubMed
Publication types
MeSH terms
Substances
Grants and funding
LinkOut - more resources
Full Text Sources
Research Materials
