Genetic basis for dosage sensitivity in Arabidopsis thaliana
- PMID: 17465685
- PMCID: PMC1857734
- DOI: 10.1371/journal.pgen.0030070
Genetic basis for dosage sensitivity in Arabidopsis thaliana
Abstract
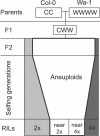
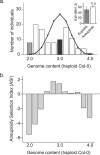
Aneuploidy, the relative excess or deficiency of specific chromosome types, results in gene dosage imbalance. Plants can produce viable and fertile aneuploid individuals, while most animal aneuploids are inviable or developmentally abnormal. The swarms of aneuploid progeny produced by Arabidopsis triploids constitute an excellent model to investigate the mechanisms governing dosage sensitivity and aneuploid syndromes. Indeed, genotype alters the frequency of aneuploid types within these swarms. Recombinant inbred lines that were derived from a triploid hybrid segregated into diploid and tetraploid individuals. In these recombinant inbred lines, a single locus, which we call SENSITIVE TO DOSAGE IMBALANCE (SDI), exhibited segregation distortion in the tetraploid subpopulation only. Recent progress in quantitative genotyping now allows molecular karyotyping and genetic analysis of aneuploid populations. In this study, we investigated the causes of the ploidy-specific distortion at SDI. Allele frequency was distorted in the aneuploid swarms produced by the triploid hybrid. We developed a simple quantitative measure for aneuploidy lethality and using this measure demonstrated that distortion was greatest in the aneuploids facing the strongest viability selection. When triploids were crossed to euploids, the progeny, which lack severe aneuploids, exhibited no distortion at SDI. Genetic characterization of SDI in the aneuploid swarm identified a mechanism governing aneuploid survival, perhaps by buffering the effects of dosage imbalance. As such, SDI could increase the likelihood of retaining genomic rearrangements such as segmental duplications. Additionally, in species where triploids are fertile, aneuploid survival would facilitate gene flow between diploid and tetraploid populations via a triploid bridge and prevent polyploid speciation. Our results demonstrate that positional cloning of loci affecting traits in populations containing ploidy and chromosome number variants is now feasible using quantitative genotyping approaches.
Conflict of interest statement
Competing interests. The authors have declared that no competing interests exist.
Figures


Similar articles
-
Dosage and parent-of-origin effects shaping aneuploid swarms in A. thaliana.Heredity (Edinb). 2009 Dec;103(6):458-68. doi: 10.1038/hdy.2009.81. Epub 2009 Jul 15. Heredity (Edinb). 2009. PMID: 19603060
-
Molecular karyotyping and aneuploidy detection in Arabidopsis thaliana using quantitative fluorescent polymerase chain reaction.Plant J. 2006 Oct;48(2):307-19. doi: 10.1111/j.1365-313X.2006.02871.x. Epub 2006 Sep 22. Plant J. 2006. PMID: 16995901
-
Transgenerational effects of inter-ploidy cross direction on reproduction and F2 seed development of Arabidopsis thaliana F1 hybrid triploids.Plant Reprod. 2019 Sep;32(3):275-289. doi: 10.1007/s00497-019-00369-6. Epub 2019 Mar 21. Plant Reprod. 2019. PMID: 30903284 Free PMC article.
-
Insights from paleogenomic and population studies into the consequences of dosage sensitive gene expression in plants.Curr Opin Plant Biol. 2012 Nov;15(5):544-8. doi: 10.1016/j.pbi.2012.08.005. Epub 2012 Aug 30. Curr Opin Plant Biol. 2012. PMID: 22939251 Review.
-
Ploidy changes and genome stability in yeast.Yeast. 2014 Nov;31(11):421-30. doi: 10.1002/yea.3037. Epub 2014 Sep 3. Yeast. 2014. PMID: 25155743 Review.
Cited by
-
Progress and Promise in using Arabidopsis to Study Adaptation, Divergence, and Speciation.Arabidopsis Book. 2010;8:e0138. doi: 10.1199/tab.0138. Epub 2010 Sep 29. Arabidopsis Book. 2010. PMID: 22303263 Free PMC article.
-
Dosage-sensitive function of retinoblastoma related and convergent epigenetic control are required during the Arabidopsis life cycle.PLoS Genet. 2010 Jun 17;6(6):e1000988. doi: 10.1371/journal.pgen.1000988. PLoS Genet. 2010. PMID: 20585548 Free PMC article.
-
Non-random chromosome arrangement in triploid endosperm nuclei.Chromosoma. 2017 Feb;126(1):115-124. doi: 10.1007/s00412-016-0578-5. Epub 2016 Feb 19. Chromosoma. 2017. PMID: 26892012
-
Aneuploidy causes tissue-specific qualitative changes in global gene expression patterns in maize.Plant Physiol. 2010 Feb;152(2):927-38. doi: 10.1104/pp.109.150466. Epub 2009 Dec 11. Plant Physiol. 2010. PMID: 20018594 Free PMC article.
-
Global Analysis of Gene Expression in Response to Whole-Chromosome Aneuploidy in Hexaploid Wheat.Plant Physiol. 2017 Oct;175(2):828-847. doi: 10.1104/pp.17.00819. Epub 2017 Aug 18. Plant Physiol. 2017. PMID: 28821592 Free PMC article.
References
-
- Blakeslee A. Variation in Datura due to changes in chromosome number. Am Nat. 1922;56:16–31.
-
- Khush G. Cytogenetics of aneuploids. New York: Academic Press; 1973. 301
Publication types
MeSH terms
Grants and funding
LinkOut - more resources
Full Text Sources
Research Materials
Miscellaneous

