. 2007 Jun;1773(6):970-89.
doi: 10.1016/j.bbamcr.2007.03.012. Epub 2007 Mar 28.

Homologous desensitization of signalling by the alpha (alpha) isoform of the human thromboxane A2 receptor: a specific role for nitric oxide signalling

Affiliations

Homologous desensitization of signalling by the alpha (alpha) isoform of the human thromboxane A2 receptor: a specific role for nitric oxide signalling

Leanne P Kelley-Hickie et al. Biochim Biophys Acta. 2007 Jun.

Abstract

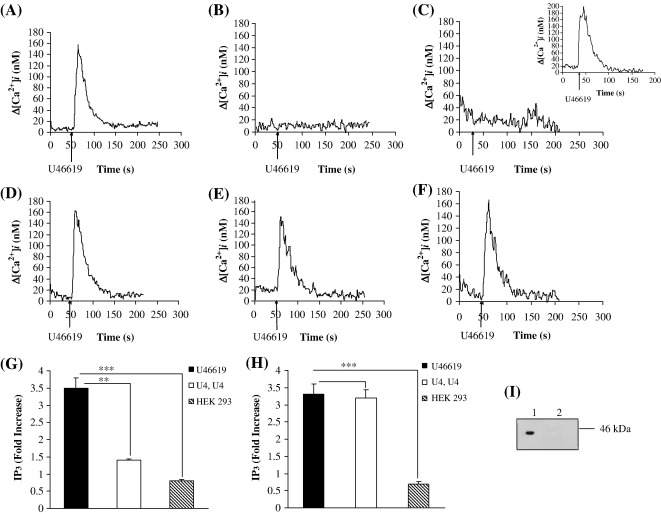
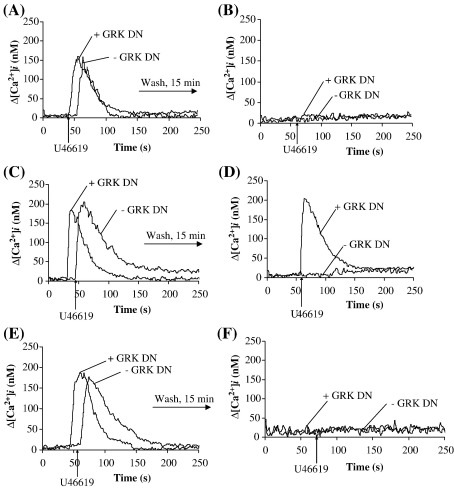
Thromboxane (TX) A(2) plays a central role in hemostasis, regulating platelet activation status and vascular tone. We have recently established that the TP beta isoform of the human TXA(2) receptor (TP) undergoes rapid, agonist-induced homologous desensitization of signalling largely through a G protein-coupled receptor kinase (GRK) 2/3-dependent mechanism with a lesser role for protein kinase (PK) C. Herein, we investigated the mechanism of desensitization of signalling by the TP alpha isoform. TP alpha undergoes profound agonist-induced desensitization of signalling (intracellular calcium mobilization and inositol 1,4,5 trisphosphate generation) in response to the TXA(2) mimetic U46619 but, unlike that of TP beta, this is independent of GRKs. Similar to TP beta, TP alpha undergoes partial agonist-induced desensitization that occurs through a GF 109203X-sensitive, PKC mechanism where Ser(145) within intracellular domain (IC)(2) represents the key phospho-target. TP alpha also undergoes more profound sustained PKC- and PKG-dependent desensitization where Thr(337) and Ser(331), respectively, within its unique C-tail domain were identified as the phospho-targets. Desensitization was impaired by the nitric oxide synthase (NOS), soluble guanylyl cyclase (sGC) and PKG inhibitors L-NAME, LY 83583 and KT5823, respectively, indicating that homologous desensitization of TP alpha involves nitric oxide generation and signalling. Consistent with this, U46619 led to rapid phosphorylation/activation of endogenous eNOS. Collectively, data herein suggest a mechanism whereby agonist-induced PKC phosphorylation of Ser(145) partially and transiently impairs TP alpha signalling while PKG- and PKC-phosphorylation at both Ser(331) and Thr(337), respectively, within its C-tail domain profoundly desensitizes TP alpha, effectively terminating its signalling. Hence, in addition to the agonist-mediated PKC feedback mechanism, U46619-activation of the NOS/sGC/PKG pathway plays a significant role in inducing homologous desensitization of TP alpha.


Figures

Fig. 1
Fig. 1
Schematic of the carboxyl (C) tail domain of TPα. The amino acid sequence of the carboxyl terminal (C)-tail domain of TPα (residues 321–343) is shown, where residues unique to TPα (residues 329–343) are underlined. The truncation (Δ) mutant TPαΔ336, generated by conversion of Leu336 codon to a stop codon, is indicated by the open arrow head while Ser/Thr to Ala substitutions to generate TPαS329A, TPαS331A, TPαT337A and TPαT340A mutations are indicated by the solid arrows. The combination substitutions TPαS329,331A, TPαS331,T337A, TPαS331,340A, TPαT337,S340A and TPαS331,T337,S340A were also generated. Mutations involving Ser145 or Ser239 within IC2 or IC3, respectively, either alone or in combination with the C-tail mutations are not shown.
Fig. 2
Fig. 2
U46619-mediated desensitization of signalling by TPα. Panels A–F: HEK.TPα (Panels A–C) or HEK.TPΔ328 (Panels D–F) cells, transiently co-transfected with pCMV:Gαq, were stimulated with 1 μM U46619 for 4 min as primary stimulation (Panels A and D). Thereafter, cells were washed to remove the U46619 as indicated by the horizontal arrow and were then re-stimulated with 1 μM U46619 either 15 min (Panels B and E) or 60 min (Panels C and F) following the primary U46619 stimulation, where ligands were added at the times indicated by the vertical arrows. Panel C, inset: HEK.TPα cells were stimulated with vehicle for 4 min as the initial primary stimulation (data not shown) prior to washout and subsequent stimulation with 1 μM U46619 at 60 min. Data presented are plotted as changes in intracellular Ca2+ mobilization (Δ[Ca2+]i, nM) as a function of time (second, s). Actual mean changes in U46619-induced [Ca2+]i mobilization (nM ± S.E.M.) were as follows: Panel A: Δ[Ca2+]i = 174 ± 8.8 nM; Panel B: Δ[Ca2+]i = 0 nM; Panel C: Δ[Ca2+]i = 0 nM; Panel C inset: Δ[Ca2+]i = 191.5 ± 25.5 nM; Panel D: Δ[Ca2+]i = 180 ± 5.6 nM; Panel E: Δ[Ca2+]i = 158 ± 3.8 nM; Panel F: Δ[Ca2+]i = 178 ± 6.7 nM. Panels G and H: HEK.TPα (Panel G) or HEK.TPΔ328 (Panel H) cells, transiently co-transfected with pCMV:Gαq or, as controls, HEK 293 cells (Panels G and H; HEK 293) were stimulated with 1 μM U46619 for 2 min (U46619); alternatively, cells were stimulated with 1 μM U46619 for 2 min, washed to remove the agonist and re-stimulated 60 min following the primary stimulation with 1 μM U46619 for 2 min (U4,U4). Levels of IP3 produced in ligand-stimulated cells relative to vehicle (HBS)-treated cells (basal IP3) were expressed as fold stimulation of basal (fold increase in IP3 ± S.E.M.; n = 4). The asterisks indicate that the level of U46619-mediated IP3 generation was significantly reduced following secondary stimulation compared to that of the primary stimulation, or that the level of U46619-mediated IP3 generation was significantly lower in HEK 293 cells than in each of the above cell lines where ** and *** indicates p < 0.01 and p < 0.001, respectively. Basal levels of IP3 in HEK.TPα (Panel G), HEK.TPΔ328 (Panel H) and HEK 293 cells (Panels G and H) were found to be in the range of 0.27–0.39 nmol/mg protein. Panel I: HEK.TPα cells co-transfected with pCMV:Gαq (lane 1) or the control vector pCMV5 (lane 2) were analysed by SDS PAGE (75 μg whole cell protein analysed/lane) followed by western blot analysis using anti-Gαq antibody (Gαq/11 (C-19): S.C. 392). Data presented is a representative immunoblot from four independent experiments. The relative position of the 46-kDa molecular size marker is indicated to the right of Panel I.
Fig. 3
Fig. 3
Effect of H-89 and GF 109203X on U46619-mediated desensitization of TPα signalling. Panels A–F: HEK.TPα (Panels A and B) or, as controls, HEK.TPΔ328 (Panels C and D) cells were pre-incubated for 10 min with either 10 μM H-89 (Panels A and C) or 50 nM GF 19203X (Panels B and D) prior to stimulation for 4 min with 1 μM U46619 (primary stimulation; Panels A, B, C and D); cells were then washed to remove the U46619 and were then re-stimulated at 15 min following the primary stimulation with 1 μM U46619 in the presence of 10 μM H-89 (Secondary stimulation; Panels A and C) or 50 nM GF 109203X (Secondary stimulation; Panels B and D). Data presented are representative profiles from at least four independent experiments and are plotted as changes in intracellular Ca2+ mobilization (Δ[Ca2+]i, nM) as a function of time (second, s), where ligands were added at the times indicated by the arrows. Actual mean changes in U46619-induced [Ca2+]i mobilization (nM ± S.E.M.) in response to primary and secondary U46619-stimulations were: Panel A: Δ[Ca2+]i = 220 ± 9.2 nM, 0 nM; Panel B: Δ[Ca2+]i = 250 ± 12 nM, 90 ± 8 nM; Panel C: Δ[Ca2+]i = 180 ± 10 nM, 165 ± 8 nM; Panel D: Δ[Ca2+]i = 200 ± 9.8 nM, 200 ± 12 nM. Panels E and F: HEK.TPαS145A (Panel E) or HEK.TPS145A,Δ328 (Panel F) cells were stimulated for 4 min with 1 μM U46619 (Primary stimulation; Panels E and F); thereafter, cells were washed and re-stimulated at 15 min following the primary stimulation with 1 μM U46619 (Secondary stimulation; Panels E and F). Actual mean changes in U46619-induced [Ca2+]i mobilizations (nM ± S.E.M.) in response to primary and secondary U46619-stimulations were: Panel E: Δ[Ca2+]i = 157 ± 3.8 nM, 37 ± 4.2 nM; Panel F: Δ[Ca2+]i = 174 ± 7.7 nM, 170 ± 9.9 nM.
Fig. 4
Fig. 4
Role of GRK2/3 on U46619-mediated desensitization of signalling by TPα and TPβ. HEK.TPα (Panels A and B), HEK.TPβ (Panels C and D) or HEK.TPαS239A (Panels E and F) cells each transiently co-transfected with either pCMV:Gαq plus pRK5:βARK1495–689 (+ GRKDN) or, as controls, with pCMV:Gαq plus pRK5 (− GRKDN) were stimulated with 1 μM U46619 for 4 min (Panels A, C and E). Thereafter, cells were washed as indicated by the horizontal arrow and re-stimulated at 15 min following the primary stimulation with 1 μM U46619 (Panels B, D and F), where ligands were added at the times indicated by the vertical arrows. Actual mean changes in U46619-induced [Ca2+]i mobilization (nM ± S.E.M.) were: Panel A: + GRKDN, Δ[Ca2+]i = 150 ± 7.5 nM; − GRKDN, Δ[Ca2+]i = 165 ± 9 nM; Panel B: + GRKDN, Δ[Ca2+]i = 0 nM; − GRKDN, Δ[Ca2+]i = 0 nM; Panel C: + GRKDN, Δ[Ca2+]i = 195 ± 11 nM; − GRKDN, Δ[Ca2+]i = 180 ± 6.7 nM; Panel D: + GRKDN, Δ[Ca2+]i = 210 ± 12 nM; − GRKDN, Δ[Ca2+]i = 0 nM. Panel E: + GRKDN, Δ[Ca2+]i = 180 ± 9 nM; − GRKDN, Δ[Ca2+]i = 176 ± 10.3 nM; Panel F: + GRKDN, Δ[Ca2+]i = 0 nM; − GRKDN, Δ[Ca2+]i = 0 nM.
Fig. 5
Fig. 5
Role of the C-tail domain in agonist-induced desensitization of TPα signalling. Panels A–N: HEK.TPαS329A (Panels A and B), HEK.TPαS331A (Panels D and E), HEK.TPαΔ336 (Panels G and H), HEK.TPαT337A (Panels J and K) or HEK.TPαS340A (Panels M and N) cells, each co-transfected with pCMV:Gαq, were stimulated with 1 μM U46619 for 4 min as primary stimulation (Panels A, D, G, J and M). Thereafter, cells were washed to remove the U46619 as indicated by the horizontal arrow and were then re-stimulated 15 min following the primary stimulation with 1 μM U46619 (Panels B, E, H, K and N), where ligands were added at the times indicated by the vertical arrows. Data presented are plotted as changes in intracellular Ca2+ mobilization (Δ[Ca2+]i, nM) as a function of time (second, s). Actual mean changes in U46619-induced [Ca2+]i mobilization (nM ± S.E.M.) were as follows: Panel A: Δ[Ca2+]i = 228 ± 7.7 nM; Panel B: Δ[Ca2+]i = 0 nM; Panel D: Δ[Ca2+]i = 207 ± 9.1 nM; Panel E: Δ[Ca2+]i = 80 ± 6.8 nM; Panel G: Δ[Ca2+]i = 240 ± 14 nM; Panel H: Δ[Ca2+]i = 50 ± 3.4 nM, Panel J: Δ[Ca2+]i = 200 ± 9.2 nM; Panel K: Δ[Ca2+]i ± 49 ± 5 nM, Panel M: Δ[Ca2+]i = 180 ± 6.1 nM; Panel N: Δ[Ca2+]i ± 0 nM. Alternatively: HEK.TPαS329A (Panel C), HEK.TPαS331A (Panel F), HEK.TPαΔ336 (Panel I), HEK.TPαT337A (Panel L), or HEK.TPαS340A (Panel O) cells, co-transfected with pCMV:Gαq, were stimulated with 1 μM U46619 for 2 min (Panels C, F, I, L and O; U46619); cells were then washed and re-stimulated at 60 min following the primary stimulation with 1 μM U46619 for 2 min (Panels C, F, I, L and O; U4, U4). As controls, HEK 293 cells were stimulated for 2 min with 1 μM U46619 (Panels C, F, I, L and O; HEK 293). Levels of IP3 produced in ligand-stimulated cells relative to the vehicle (HBS) treated cells (basal IP3) were expressed as fold stimulation of basal (fold increase in IP3 ± S.E.M.; n = 4). The asterisks indicate that the level of U46619-mediated IP3 generation was significantly reduced following secondary stimulation compared to that of the primary stimulation, or that the level of U46619-mediated IP3 generation was significantly lower in HEK 293 cells than in each of the above cell lines where *, ** and *** indicates p < 0.05, p < 0.01 and p < 0.001, respectively. Basal levels of IP3 in the latter cell lines were found to be in the range of 0.27 ± 0.06–0.39 ± 0.09 nmol/mg protein.
Fig. 6
Fig. 6
Role of the C-tail domain in agonist-induced desensitization of TPα signalling. Panels A–J: HEK.TPαS329,331A (Panels A and B), HEK.TPαS331,340A (Panels C and D), HEK.TPαT337,S340A (Panels E and F), HEK.TPαS331,T337A (Panels G and H), or HEK.TPS331,T337,S340A (Panels I and J) cells, each co-transfected with pCMV:Gαq, were stimulated with 1 μM U46619 for 4 min as primary stimulation (Panels A, C, E, G and I). Thereafter, cells were washed to remove the U46619 as indicated by the horizontal arrow and were then re-stimulated 15 min following the primary stimulation with 1 μM U46619 (Panels B, D, F, H and J), where ligands were added at the times indicated by the vertical arrows. Data presented are plotted as changes in intracellular Ca2+ mobilization (Δ[Ca2+]i, nM) as a function of time (second, s). Actual mean changes in U46619-induced [Ca2+]i mobilization (nM ± S.E.M.) were as follows: Panel A: Δ[Ca2+]i = 176 ± 9.4 nM; Panel B: Δ[Ca2+]i = 63 ± 4.4 nM; Panel C: Δ[Ca2+]i = 160 ± 7.2 nM; Panel D: Δ[Ca2+]i = 60 ± 10 nM; Panel E: Δ[Ca2+]i = 179 ± 11 nM; Panel F: Δ[Ca2+]i = 40 ± 3.4 nM; Panel G: Δ[Ca2+]i = 181 ± 6.5 nM; Panel H: Δ[Ca2+]i = 60 ± 7.1 nM, Panel I: Δ[Ca2+]i = 195 ± 12 nM; Panel J: Δ[Ca2+]i = 67 ± 8.2 nM.
Fig. 7
Fig. 7
U46619-mediated phosphorylation of TPα. Panels A and B: HEK.TPα (Panel A) and HEK.TPαS331A cells (Panel B), metabolically labelled with [32P]orthophosphate, were pre-incubated for 15 min with 50 nM KT 5923 (Panels A and B, lane 3) prior to incubation for 10 min with the vehicle HBS (Panels A and B; lane 1) or 1 μM U46619 (Panels A and B; lanes 2 and 3). Immunoprecipitates were resolved by SDS-PAGE and electroblotted onto PVDF membranes. Blots were subject to PhosphorImage analysis and the intensities of U46619-mediated TPα phosphorylation relative to basal phosphorylation in the presence of HBS were determined and expressed in arbitrary units as follows: TPα: 1 μM U46619, 5-fold increase; 1 μM U46619 plus 50 nM KT 5923, 2-fold; TPαS331: 1 μM U46619, 2-fold increase; 1 μM U46619 plus 50 nM KT 5923, 1.5-fold. Panel C: HEK.TPα, HEK.TPαS331A and, as a control, HEK 293 cells (Panel C, lanes 1–3, respectively) were subject to immunoprecipitation with anti-HA antibody 101R and immunoblots screened using the anti-HA 3F10 horseradish peroxidase-conjugated antibody followed by chemiluminescence detection. The positions of the molecular weight markers (kDa) are indicated to the left and right of the panels A and C. The arrow to the left of Panel A indicates the approximate position of the phosphorylated TPα. Data presented are representative of three independent experiments. Panel D: HEK.TPα , HEK.TPαS331A and HEK.TPαS331,T337A  cells, metabolically labelled with [32P]orthophosphate, were stimulated for 10 min with 1 μM U46619 (+) or with an equivalent volume of the vehicle HBS (−). Thereafter, HA epitope-tagged TPβ receptors were immunoprecipitated as previously described. Blots were subject to PhosphorImage analysis and the intensities of U46619-mediated TPα phosphorylation relative to basal levels in the presence of HBS were determined and expressed in arbitrary units (Phosphorylation; fold increase, n = 3).
Fig. 8
Fig. 8
Effect of KT 5823, LY 83583 and l-NAME on U46619-mediated desensitization of TPα signalling. Panels A–F: HEK.TPα (Panels A–F) or, as controls, HEK.TPβ (Insets A–F) cells were pre-incubated for 15 min with either 50 nM KT 5823 (Panels and Insets A and B), 1 μM LY 83583 (Panels and Insets C and D) or 1 μM l-NAME (Panels and Insets E and F) prior to stimulation with 1 μM U46619 (primary stimulation; Panels and Insets A, C and E); cells were then washed to remove the U46619 as indicated by the horizontal arrow and were then re-stimulated at 15 min following the primary stimulation with 1 μM U46619 in the presence of 50 nM KT 5823 (Panels and Insets B), 1 μM LY 83583 (Panels and Insets D) or 1 μM l-NAME (Panels and Insets F). Data presented are representative profiles from at least four independent experiments and are plotted as changes in intracellular Ca2+ mobilization (Δ[Ca2+]i, nM) as a function of time (second, s), where the ligands were added at the times indicated by the arrows. Actual mean changes in U46619-induced [Ca2+]i mobilization (nM ± S.E.M.) were: Panel A: Δ[Ca2+]i = 160 ± 7.9 nM; Panel B: Δ[Ca2+]i = 60 ± 7 nM; Panel C: Δ[Ca2+]i = 210 ± 12 nM; Panel D: Δ[Ca2+]i = 58 ± 6 nM; Panel E: Δ[Ca2+]i = 200 ± 9 nM; Panel F: Δ[Ca2+]i = 80 ± 5.9 nM. Inset A: Δ[Ca2+]i = 170 ± 25 nM; Inset B: Δ[Ca2+]i = 0 nM; Inset C: Δ[Ca2+]i = 185 ± 26 nM; Inset D: Δ[Ca2+]i = 0 nM; Inset E: Δ[Ca2+]i = 220 ± 40 nM; Inset F: Δ[Ca2+]i = 0 nM.
Fig. 9
Fig. 9
Analysis of nitric oxide synthase (NOS) expression and activation in HEK 293 cells. Panel A: RT-PCR analysis of 1° cDNA from HEK 293 cells as template and primer pairs to selectively amplify neuronal (n)NOS (lane 1), endothelial (e)NOS (lane 3) or inducible (i)NOS (lane 5); negative controls where individual primer pairs were added to the reaction without template cDNA are shown in lanes 2 (nNOS), 4 (eNOS) and 6 (iNOS). Molecular weight markers are shown in lanes M, and the position of the 350- and 517-bp markers are indicated to the left and right of the panel. PCR products corresponding to (n)NOS (lane 1; 456 bp) and (e)NOS (lane 3; 354 bp) were specifically amplified. Panel B: western blot analysis of eNOS expression. Aliquots (100 μg and 200 μg, respectively) of HEK 293 cell protein was analysed by SDS-PAGE followed by western blot analysis using anti-eNOS antibody. The relative position of the 120-kDA marker is indicated to the left of the panel. Results shown in Panel C: Phosphorylation of eNOS in HEK.TPα cells. HEK.TPα cells were incubated at 37 °C for 5 min with either vehicle, 1 μM U46619 or 10 U/ml Thrombin. Whole cell protein was analysed by SDS-PAGE followed by western blot analysis using anti-phospho eNOS1177 and anti-eNOS, as indicated. The relative position of the 120-kDA marker is indicated to the left of the panel. Results shown in Panels A–C are representative of 3 independent experiments.
Fig. 10
Fig. 10
Proposed mechanism of U46619-mediated, homologous desensitization of TPα signalling. Ligand (U46619)-engagement of TPα stimulates Gq-mediated PLCβ activation leading to increases in IP3 generation and mobilization of [Ca2+]i. The latter rise in [Ca2+]i triggers activation of endothelial nitric-oxide synthase (eNOS) promoting conversion of l-arginine to nitric oxide (NO). U46619-mediated TPα activation can also lead to increased phosphorylation of eNOS at Ser1177, through an as yet unknown mechanism, contributing to eNOS activation (not shown). NO in turn activates the soluble form of guanylyl cyclase (sGC) leading to a rise in intracellular cGMP and, in turn, activation of protein kinase (PK) G. PKG, in turn, phosphorylates and inhibits signalling by TPα where Ser331 has been identified as the target residue for PKG phosphorylation. U46619-mediated desensitization of TPα signalling may be inhibited by the NOS inhibitor l-NAME, by the sGC inhibitor LY 83583 or by the PKG inhibitor KT5823. Additionally, TPα/Gαq/PLCβ mediated-increase in DAG leads to activation of PKC; PKC can phosphorylate TPα at Ser145 and Thr337 yielding partial U46619-mediated desensitization of TPα signalling. Thus, U46619-induced homologous desensitization of TPα is partially mediated through both PKG and PKC-catalysed mechanisms where Ser331 and Ser145/Thr337 have been identified as the respective phospho-targets.

Similar articles

Cited by

References

    1. Narumiya S., Sugimoto Y., Ushikubi F. Prostanoid receptors: structures, properties, and functions. Physiol. Rev. 1999;79:1193–1226. - PubMed
    1. Sugimoto Y. Physiological functions of prostanoid receptors and their subtypes. Nippon Yakurigaku Zasshi. 2000;115:131–141. - PubMed
    1. Hanasaki K., Nakano T., Arita H. Receptor-mediated mitogenic effect of thromboxane A2 in vascular smooth muscle cells. Biochem. Pharmacol. 1990;40:2535–2542. - PubMed
    1. Dorn G.W., II, Becker M.W., Davis M.G. Dissociation of the contractile and hypertrophic effects of vasoconstrictor prostanoids in vascular smooth muscle. J. Biol. Chem. 1992;267:24897–24905. - PubMed
    1. Ali S., Davis M.G., Becker M.W., Dorn G.W., II Thromboxane A2 stimulates vascular smooth muscle hypertrophy by up-regulating the synthesis and release of endogenous basic fibroblast growth factor. J. Biol. Chem. 1993;268:17397–17403. - PubMed

Publication types

MeSH terms

Substances

LinkOut - more resources