

Sensitive ultrasonic detection of dystrophic skeletal muscle in patients with duchenne muscular dystrophy using an entropy-based signal receiver
- PMID: 17467153
- PMCID: PMC2096710
- DOI: 10.1016/j.ultrasmedbio.2007.02.007
Sensitive ultrasonic detection of dystrophic skeletal muscle in patients with duchenne muscular dystrophy using an entropy-based signal receiver
Abstract
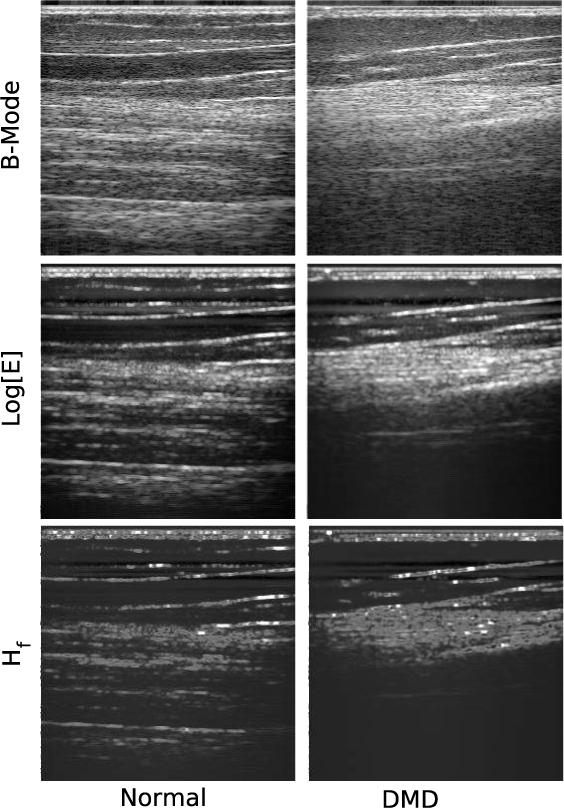
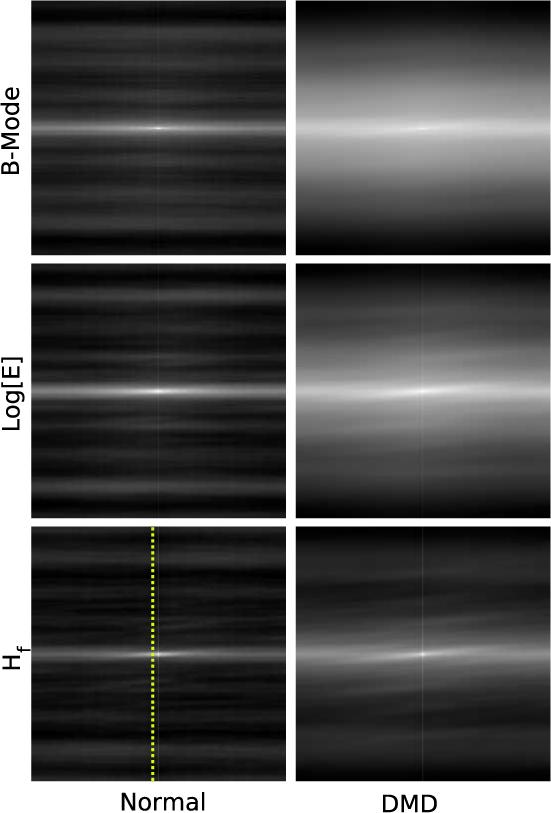
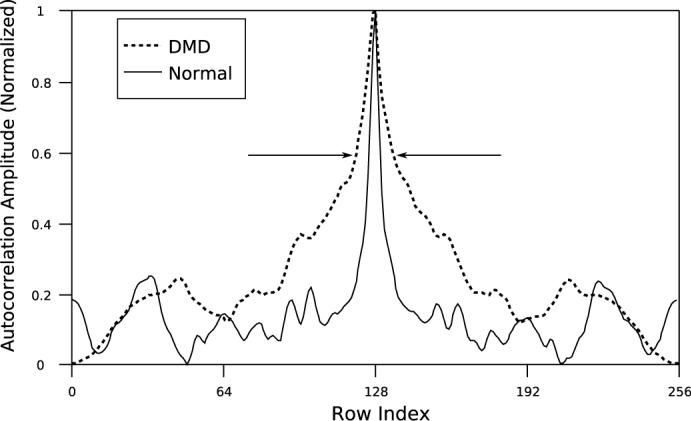
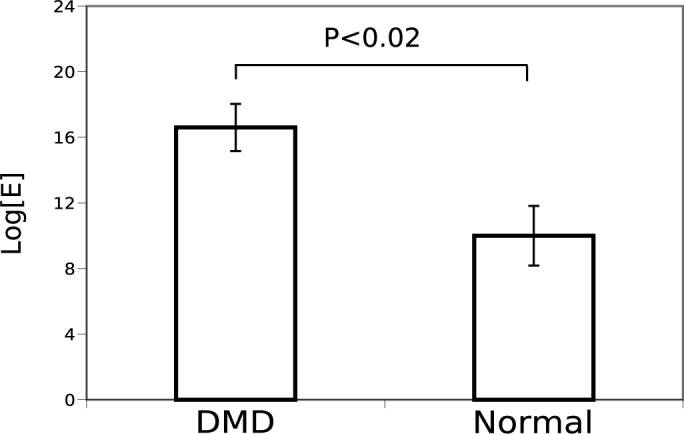
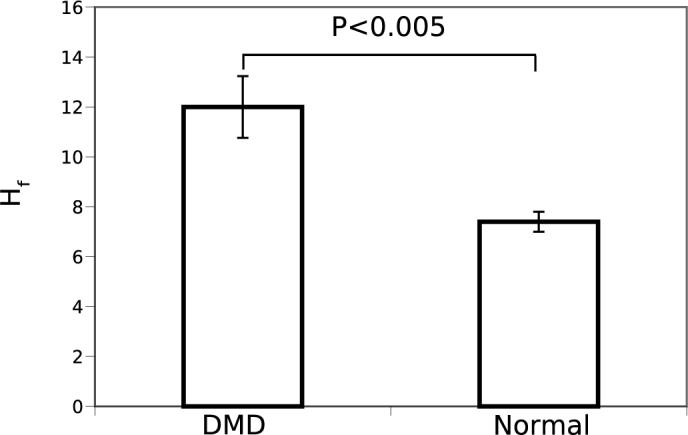
The dystrophinopathies comprise a group of X-linked genetic diseases that feature dystrophin deficiency. Duchenne and Becker muscular dystrophy are characterized by progressive weakness and wasting of skeletal, smooth, and/or cardiac muscle. Duchenne muscular dystrophy (DMD) is the most severe dystrophinopathy, with an incidence of 1:3500 male births. Despite understanding the structural and genetic basis for DMD, the pathogenesis and clinical basis for more severe involvement in specific skeletal muscle groups and the heart are poorly understood. Current techniques, such as strength testing for monitoring progress of disease and therapy in DMD patients, are imprecise and physically demanding for test subjects. Ultrasound is well-suited to detect changes in structure and organization in muscle tissue in a manner that makes low demands on the patient. Therefore, we investigated the use of ultrasound to quantitatively phenotype the remodeling process in patients with DMD. Beam-formed radio-frequency (RF) data were acquired from the skeletal muscles of nine DMD and five normal subjects imaged with a clinical imaging system (HDI5000 w/7 MHz probe applied above left biceps muscle). From these data, images were reconstructed using B-mode (log of analytic signal magnitude) and information-theoretic receivers (H(f)-receiver). H(f) images obtained from dystrophic muscle contained extensive "mottled" regions (i.e., areas with heterogeneous image contrast) that were not readily apparent from the B-Mode images. The 2-D autocorrelation of DMD H(f) images have broader peaks than those of normal subjects, which is indicative of larger scatterer sizes, consistent with pathologic changes of fibers, edema and fatty infiltration. Comparison of the relative peak widths (full width measured at 60% maximum) of the autocorrelation of the DMD and normal H(f) images shows a quantitative difference between the two groups (p < 0.005, student two-tailed paired t-test). Consequently, these imaging techniques may prove useful for longitudinal monitoring of disease progression and therapy.
Figures
References
-
- Ashford M, Lui W, Lin S, Abraszewski P, S.D., C., Connolly A, Yu X, Wickline S. “Occult cardiac contractile dysfunction in dystrophin-deficient children revealed by cardiac magnetic resonance strain imaging”. Circulation. 2005;112:2462–2467. - PubMed
-
- Berger G, Laugier P, Fink M, Perrin J. “Optimal precision in ultrasound attenuation estimation and application to the detection of duchenne muscular dystrophy carriers”. Ultrasonic Imaging. 1987;9:1–17. - PubMed
-
- Cover TM, Thomas JA. Elements of Information Theory. Wiley-Interscience; New York: 1991.
-
- Emery AE. “Muscular dystrophy into the new millennium”. Neuromuscul Disorders. 2002;12:343–9. - PubMed
-
- Finsterer J, Stollberger C. “The heart in human dystrophinopathies”. Cardiology. 2003;99:1–19. - PubMed
Publication types
MeSH terms
Substances
Grants and funding
LinkOut - more resources
Full Text Sources
Other Literature Sources
Research Materials
Miscellaneous
