. 2007 Jun;35(2):339-55.
doi: 10.1016/j.mcn.2007.03.009. Epub 2007 Mar 24.

PICK1 interacts with alpha7 neuronal nicotinic acetylcholine receptors and controls their clustering

Affiliations

PICK1 interacts with alpha7 neuronal nicotinic acetylcholine receptors and controls their clustering

Kristin Baer et al. Mol Cell Neurosci. 2007 Jun.

Abstract

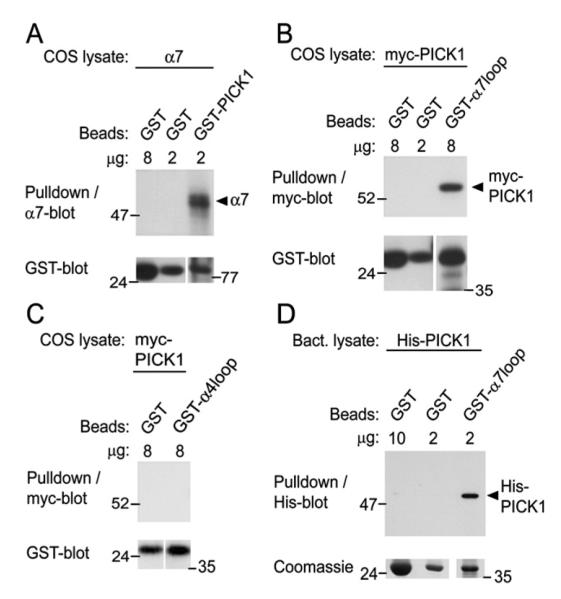
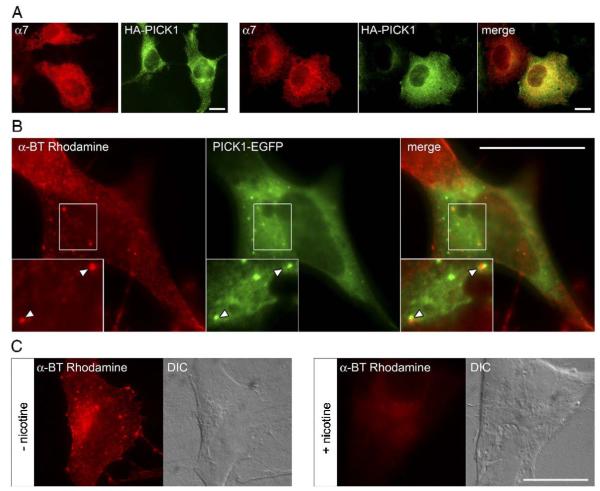
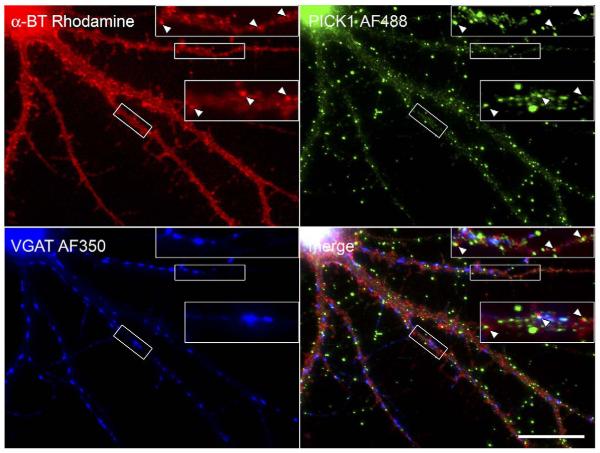
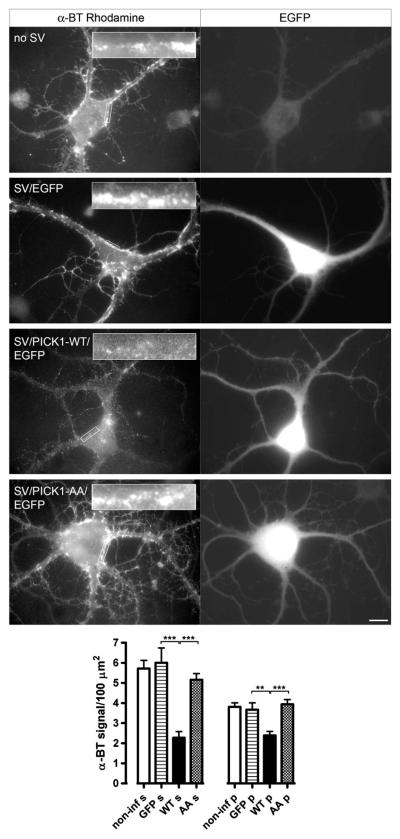
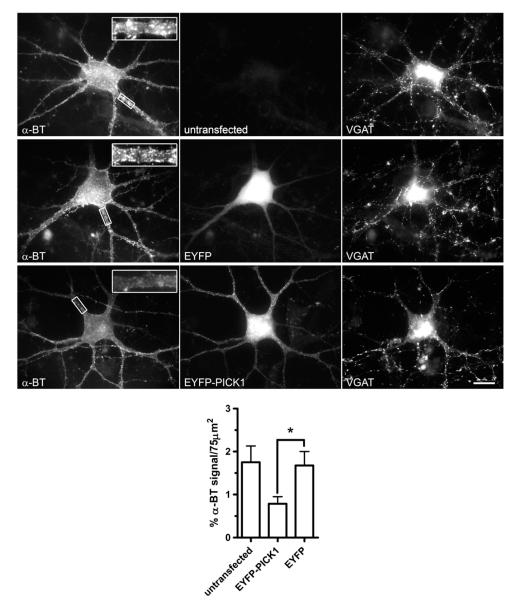
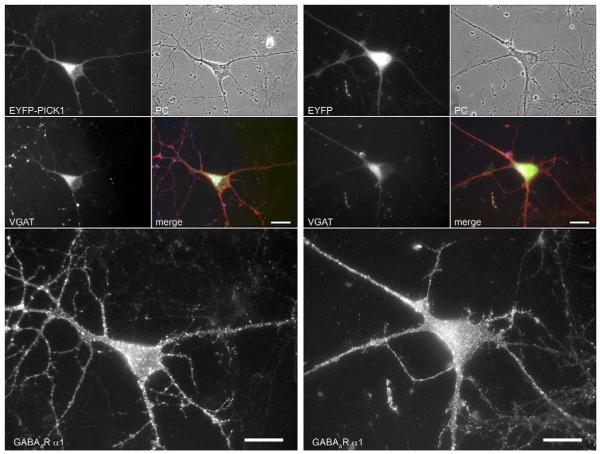
Central to synaptic function are protein scaffolds associated with neurotransmitter receptors. Alpha7 neuronal nicotinic acetylcholine receptors (nAChRs) modulate network activity, neuronal survival and cognitive processes in the CNS, but protein scaffolds that interact with these receptors are unknown. Here we show that the PDZ-domain containing protein PICK1 binds to alpha7 nAChRs and plays a role in their clustering. PICK1 interacted with the alpha7 cytoplasmic loop in yeast in a PDZ-dependent way, and the interaction was confirmed in recombinant pull-down experiments and by co-precipitation of native proteins. Some alpha7 and PICK1 clusters were adjacent at the surface of SH-SY5Y cells and GABAergic interneurons in hippocampal cultures. Expression of PICK1 caused decreased alpha7 clustering on the surface of the interneurons in a PDZ-dependent way. These data show that PICK1 negatively regulates surface clustering of alpha7 nAChRs on hippocampal interneurons, which may be important in inhibitory functions of alpha7 in the hippocampus.


Figures

Fig. 1
Fig. 1
Interaction between α7 nAChR and PICK1 in yeast. (A) Yeast strain AH109 was cotransformed with plasmids encoding the GAL4 DNA-binding domain fused to different sequences of the cytoplasmic loop of rat α7 nAChR (or rat α4or β2 nAChR, as indicated) and the GAL4 activation domain fused to different PICK1 sequences. Protein–protein interaction was assayed by growing the yeast on selective medium and by galactosidase assays. The specificity of this interaction was tested using control plasmids; + indicates interaction, – no interaction. n.d., not done. (B) PICK1 prey constructs used. CC, coiled coil domain; AR, acidic region. (C) Sequence alignment of the bait 9 region of α7 with other nAChR subunits and with the C-terminus of other proteins known to bind PICK1. A separate alignment of α7 with Arf1 and Arf3 is shown at the bottom. Note the two putative PDZ-binding motifs, EVRYand ESEV. (D) Mutation of the putative PDZ-binding motifs (EVRY and ESEV) in α7 nAChR bait 1 and bait 9. The interaction with PICK1 prey vectors was not affected. Polarity colors mark the residues according to the polarity of amino acids (www.clcbio.com).
Fig. 2
Fig. 2
Interaction of recombinant α7 and PICK1. (A–C) COS cells were transfected with full-length α7 or myc-PICK1 expression constructs, lysed and incubated with the indicated amounts of GST proteins immobilized on beads. Bead pellets were analysed by α7- or myc-immunoblotting, and blots were reprobed for GST, showing that GST-PICK1 precipitates α7 from the COS lysate (A), while GST-α7loop pulls down myc-PICK1 (B), and GST-α4loop does not pull down myc-PICK1 (C). As a control, non-transfected COS cells produced no immunoblot signals (not shown). Panels of GST-blots show GST, GST-PICK1, GST-α7loop or GST-α4loop proteins at their respective molecular weights. To probe α7 nAChR, the following antibodies were used for immunoblots: polyclonal anti-α7 (Santa Cruz; shown) and mAb306 (not shown), with identical results. (D) Bacteria expressing His-PICK1 were lysed, incubated with the indicated GST beads, and precipitates were analyzed by His-immunoblotting, showing that GST-α7 loop pulls down His-PICK1. Parallel samples were Coomassie-stained to reveal GST and GST-α7loop proteins, shown at their respective molecular weight.
Fig. 3
Fig. 3
Interaction of endogenous α7 nAChRs and PICK1 in adult rat brain. (A) Synaptosomes were prepared from dissected hippocampi of adult rats, and α7 nAChRs were precipitated with α-BT-Sepharose beads (Tox-P). As controls for specificity, excess free α-BT (+T) was added. A fraction of the total synaptosomal lysate was loaded as a control (Tot). PICK1 immunoblotting reveals specific association with α7 nAChRs, which themselves are visualized in an α7-blot using mAb306 (shown) or mAb319 (not shown; identical results). (B) From adult rat brain lysates, α7 nAChRs were precipitated with α-BT-Sepharose beads (Tox-P) and analyzed by PICK1- or α7-immunoblotting (anti-α7 from Abcam). Nicotine-competition eliminated the α7 nAChR signal and strongly reduced the PICK1 signal, demonstrating specific α7–PICK1-association. (C) Synaptosomes (left) or total hippocampal tissue (right) were prepared from hippocampus (Hip), cerebellum (Cer) or cortex (Cor), lysed, and α7 precipitated using mAb319. As controls, mAb319 was omitted (Ab), brain tissue was left out, or a fraction of total hippocampal synaptosomes was loaded without precipitation (Tot). α7-associated PICK1 was visualized by immunoblotting and mostly detected in hippocampus. Levels of α7 were highest in hippocampus, as revealed by α7-immunoblotting (not shown). Nonimmune IgG was used as a control (right). *Indicates the non-immune IgG antibody band, and **denotes the α7-antibody band. (D) Hippocampal synaptosomes were processed as in panel C, but antibodies against the PSD95-family or GluR2 were used for immunoblotting. PSD95-family proteins and GluR2 AMPAR subunits were present in hippocampal synaptosomes but not associated with α7.
Fig. 4
Fig. 4
Partial colocalization of α7 and PICK1 in transfected heterologous cells. (A) COS cells were transfected either with α7 expression vector or with HA-tagged PICK1 expression construct (left). Alternatively, they were transfected with both plasmids (right). Cells were permeabilized, stained for α7 using anti-α7 antibodies (red), HA-tag (green), or both, and analyzed by conventional fluorescence microscopy. Anti-α7 antibodies were from Abcam (shown) or mAb306 (not shown), with identical results. In all cases, α7 and PICK1 signals are diffuse and around the nucleus. Coexpression does not affect this and reveals partial overlay in the perinuclear area (yellow). Untransfected COS cells produced no signal (not shown). Scale bar, 20 μm. (B) SH-SY5Y cells stably expressing α7 were transfected with PICK1-EGFP expression vector using magnetofection. They were subjected to surface staining of α7 (using α-BT-rhodamine, red) and analyzed by fluorescence microscopy. A cell expressing α7 clusters is shown, with PICK1-EGFP expression in green. This EGFP signal is diffuse and in clusters; the clusters partially overlap and are adjacent to the α7 clusters (note the arrowheads in the white box, which was rotated 90° clockwise to produce the higher magnification insert). In cells not transfected with PICK1-EGFP (not shown), α7 clusters are very similar. Scale bar, 20 μm. (C) As control for specificity, SH-SY5Y cells were stained with α-BT-rhodamine in the presence or absence of nicotine. Differential interference contrast (DIC) shows the cells present. Nicotine-competition (1 mM nicotine added 10 min before α-BT-rhodamine) caused a strong reduction in α-BT surface staining, demonstrating the specificity of the α-BT signal for α7 receptors. Scale bar, 20 μm.
Fig. 5
Fig. 5
α7 nAChRs are clustered at the surface of GABAergic hippocampal interneurons. Cultured dissociated hippocampal neurons were labeled with fluorescent α-BT, permeabilized, and incubated with antibodies against VGAT or GAD followed by fluorescent secondary antibodies. Image overlays reveal that α7-expressing cells are VGAT- and GAD-positive. α7 clusters occur on the soma, often grouped into larger aggregates, and more individually along dendrites, and show some overlap with VGAT or GAD. Panels show a maximal projection of confocal stacks. Note the individual dendrite-associated clusters of α7 nAChRs in the higher magnification (white box). Scale bars: 20 μm.
Fig. 6
Fig. 6
Some clusters of α7 and PICK1 are adjacent and partially overlapping at the surface of hippocampal interneurons. Cultured hippocampal neurons were labeled with α-BT-rhodamine, permeabilized, and incubated with PICK1 and VGAT antibodies, followed by secondary AlexaFluor 488- and 350-coupled antibodies and fluorescence microscopical analysis. The panel demonstrates one interneuron (VGAT marker in blue) with strong α-BT-rhodamine (red) and endogenous PICK1 immunoreactivity (green). Two dendritic areas are shown enlarged with arrowheads highlighting discrete punctae immunoreactive for α7 and PICK1 clusters. The merged image shows the partial overlap of adjacent α7 nAChRs and PICK1 clusters. Scale bars: 20 μm.
Fig. 7
Fig. 7
Viral expression of PICK1 causes a reduction in surface α7 nAChR clusters in cultured hippocampal interneurons. Cultured hippocampal cells were infected with different Sindbis viruses (SV), labeled with α-BT-rhodamine and analyzed by conventional fluorescence microscopy. The panels show examples of EGFP fluorescence (right) and surface α7 nAChR staining by α-BT-rhodamine for a non-infected control neuron, a neuron infected with SV containing EGFP, a neuron infected with SV expressing PICK1-WT (wild-type) and EGFP, and a neuron infected with SV containing PICK1-AA mutant and EGFP. Inserts show magnifications of α-BT-staining of somatic regions indicated by the box (for lower-power images, scale bars are 20 μm). Wild-type PICK1 expression reduces α7 clustering. A quantitative analysis of these effects is shown at the bottom. For each neuron in a group (non-infected, EGFP virus, PICK1-WT-EGFP virus, or PICK1-AA-EGFP virus), four surface areas covering 100 μm2 (comparable to the boxes indicated in the top panels) were randomly chosen per cellular region (s, soma; p, proximal dendrites). The α-BT fluorescence intensity was quantitated and plotted per surface area (***p < 0.0001; **p < 0.0015, by unpaired two-tailed Student’s t-test). α7 surface clustering is reduced by PICK1-WT but not by PICK1-AA in somatic and proximal dendritic areas.
Fig. 8
Fig. 8
Expression of PICK1 by magnetofection causes a reduction in surface α7 nAChR clusters in cultured hippocampal interneurons. Cultured hippocampal cells were transfected with EYFP-PICK1 or EYFP constructs using magnetofection, labeled with α-BT-rhodamine and anti-VGAT antibody and analyzed by conventional fluorescence microscopy. The panels show examples of surface α7 nAChR staining by α-BT-rhodamine (left), EYFP fluorescence (middle), and VGAT staining (right) for a non-transfected control interneuron, an interneuron transfected with EYFP, and an interneuron transfected with EYFP-PICK1. PICK1 expression reduces α7 clustering. A quantitative analysis of these effects is shown at the bottom. For each neuron in a group (untransfected, EYFP-PICK1 transfected or EYFP transfected), proximal dendritic surface areas were randomly chosen (the boxes represent examples). The amount of α7 surface clusters on dendrites of transfected neurons was measured as the cumulative α-BT fluorescence area per dendritic surface area. α7 surface clustering is reduced by EYFP-PICK1 but not by EYFP in dendritic areas (*p = 0.0267; unpaired two-tailed Student’s t-test). Scale bar, 20 μm.
Fig. 9
Fig. 9
Expression of EYFP-PICK1 does not affect the distribution of GABAA receptors at the surface of interneurons. EYFP-PICK1 or EYFP constructs were expressed in cultured hippocampal neurons using magnetofection. Neurons were stained against GABAA receptor α1 subunit (red; before permeabilization) and with VGAT-antibodies (blue; after permeabilization) as markers for interneurons. The panel shows two representative interneurons, overexpressing EYFP-PICK1 (left) or EYFP (right). The four small images on the top show the EYFP-PICK1 or EYFP signal, phase contrast (PC), VGAT signal and the merged image. The large images below show the GABAA receptor α1 subunit signal. Note the abundant GABAA receptor surface clusters in both interneurons and the healthy morphology of the cells. The GABAA α1 receptor signal is not affected in interneurons after EYFP-PICK1 expression compared to control EYFP expression. Scale bars, 20 μm.

References

    1. Alkondon M, Pereira EF, Barbosa CT, Albuquerque EX. Neuronal nicotinic acetylcholine receptor activation modulates gamma-aminobutyric acid release from CA1 neurons of rat hippocampal slices. J. Pharmacol. Exp. Ther. 1997;283:1396–1411. - PubMed
    1. Alkondon M, Pereira EF, Albuquerque EX. Alpha-bungarotoxin- and methyllycaconitine-sensitive nicotinic receptors mediate fast synaptic transmission in interneurons of rat hippocampal slices. Brain Res. 1998;810:257–263. - PubMed
    1. Archibald K, Perry MJ, Molnar E, Henley JM. Surface expression and metabolic half-life of AMPA receptors in cultured rat cerebellar granule cells. Neuropharmacology. 1998;37:1345–1353. - PubMed
    1. Ben-Ami HC, Yassin L, Farah H, Michaeli A, Eshel M, Treinin M. RIC-3 affects properties and quantity of nicotinic acetylcholine receptors via a mechanism that does not require the coiled-coil domains. J. Biol. Chem. 2005;280:28053–28060. - PubMed
    1. Berg DK, Conroy WG. Nicotinic alpha 7 receptors: synaptic options and downstream signaling in neurons. J. Neurobiol. 2002;53:512–523. - PubMed

Publication types

MeSH terms