Hemodynamic response function in patients with stroke-induced aphasia: implications for fMRI data analysis
- PMID: 17467297
- PMCID: PMC2041913
- DOI: 10.1016/j.neuroimage.2007.02.035
Hemodynamic response function in patients with stroke-induced aphasia: implications for fMRI data analysis
Abstract
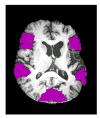
Functional MRI is based on changes in cerebral microvasculature triggered by increased neuronal oxidative metabolism. This change in blood flow follows a pattern known as the hemodynamic response function (HRF), which typically peaks 4-6 s following stimulus delivery. However, in the presence of cerebrovascular disease the HRF may not follow this normal pattern, due to either the temporal signal to noise (tSNR) ratio or delays in the HRF, which may result in misinterpretation or underestimation of fMRI signal. The present study examined the HRF and SNR in five individuals with aphasia resulting from stroke and four unimpaired participants using a lexical decision task and a long trial event-related design. T1-weighted images were acquired using an MP-RAGE sequence and BOLD T2*-weighted images were acquired using Echo Planar Imaging to measure time to peak (TTP) in the HRF. Data were analyzed using Brain Voyager in four anatomic regions known to be involved in language processing: Broca's area and the posterior perisylvian network (PPN) (including Wernicke's area, the angular and supramarginal gyri) and right hemisphere homologues of these regions. The occipital area also was examined as a control region. Analyses showed that the TTP in three out of five patients in the left perisylvian area was increased significantly as compared to normal individuals and the left primary visual cortex in the same patients. In two other patients no significant delays were detected. We also found that the SNR for BOLD signal detection may by insufficient in damaged areas. These findings indicate that obtaining physiologic (TTP) and quality assurance (tSNR) information is essential for studying activation patterns in brain-damaged patients in order to avoid errors in interpretation of the data. An example of one such misinterpretation and the need for alternative data analysis strategies is discussed.
Figures


References
-
- Amunts K, Schleicher A, Burgel U, Mohlberg H, Uylings HGM, Zilles K. Broca’s region revisited: cytoarchitecture and inter-subject variability. J Comp Neurol. 1999;412(2):319–341. - PubMed
-
- Brodtmann A, Puce A, Syngeniotis A, Darby D, Donnan G. The functional magnetic resonance imaging hemodynamic response to faces remains stable until the ninth decade. NeuroImage. 2003;20(1):520–528. - PubMed
-
- Buckner RL, Snyder AZ, Sanders AL, Raickle ME, Morris JC. Functional brain imaging of young, nondemented, and demented older adults. J Cogn Neurosci. 2000;12(Suppl 2):24–34. - PubMed
-
- Buxton RB. Mapping brain activation with BOLD-fMRI, Introduction to Functional Magnetic Resonance Imaging. 1. Cambridge Univ. Press; Cambridge: 2002. pp. 417–444.
MeSH terms
Grants and funding
LinkOut - more resources
Full Text Sources
Other Literature Sources
Medical

