

Label-free detection of mitochondrial distribution in cells by nonresonant Raman microspectroscopy
- PMID: 17468162
- PMCID: PMC1896237
- DOI: 10.1529/biophysj.106.102061
Label-free detection of mitochondrial distribution in cells by nonresonant Raman microspectroscopy
Abstract
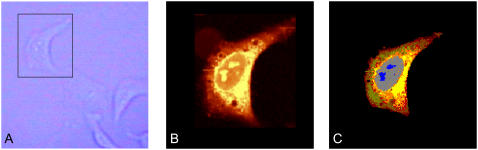
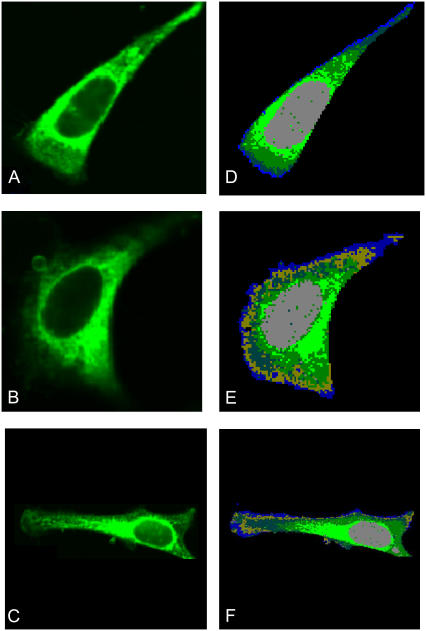
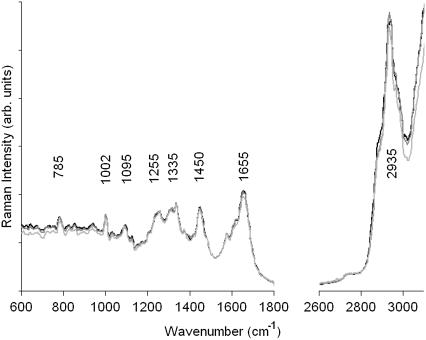
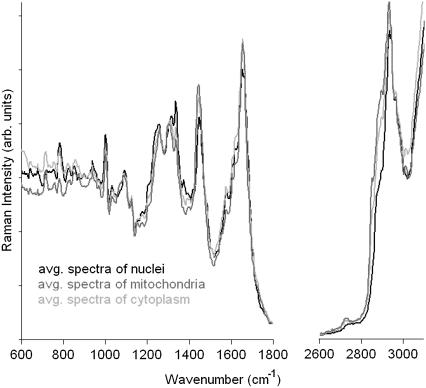
High spatial resolution Raman maps of fixed cells in an aqueous environment are reported. These maps were obtained by collecting individual Raman spectra via a Raman microspectrometer in a raster pattern on a 0.5-microm grid and assembling pseudocolor maps from the spectral hypercubes by multivariate methods. The Raman maps show the nucleus and the nucleoli of cells as well as subcellular organization in the cytoplasm. In particular, the distribution of mitochondria in the perinuclear region could be demonstrated by correlating distinct areas of the Raman maps with corresponding areas of fluorescence maps of the same cells after staining with mitochondria-specific labels. To the best of our knowledge, this is the first report of label-free detection of mitochondria inside a somatic mammalian cell using Raman microspectroscopy.
Figures
Similar articles
-
Confocal Raman microspectroscopy as an analytical tool to assess the mitochondrial status in human spermatozoa.Analyst. 2010 Jun;135(6):1370-4. doi: 10.1039/b927012d. Epub 2010 Apr 13. Analyst. 2010. PMID: 20386810
-
Cytoplasmic RNA in undifferentiated neural stem cells: a potential label-free Raman spectral marker for assessing the undifferentiated status.Anal Chem. 2012 Apr 3;84(7):3155-62. doi: 10.1021/ac202994e. Epub 2012 Mar 20. Anal Chem. 2012. PMID: 22436054
-
Studying single living cells and chromosomes by confocal Raman microspectroscopy.Nature. 1990 Sep 20;347(6290):301-3. doi: 10.1038/347301a0. Nature. 1990. PMID: 2205805
-
Shining light on the microbial world the application of Raman microspectroscopy.Adv Appl Microbiol. 2010;70:153-86. doi: 10.1016/S0065-2164(10)70005-8. Epub 2010 Mar 6. Adv Appl Microbiol. 2010. PMID: 20359457 Review.
-
Raman microspectroscopy for non-invasive biochemical analysis of single cells.Biochem Soc Trans. 2007 Jun;35(Pt 3):544-9. doi: 10.1042/BST0350544. Biochem Soc Trans. 2007. PMID: 17511648 Review.
Cited by
-
Lipid droplets: a new player in colorectal cancer stem cells unveiled by spectroscopic imaging.Stem Cells. 2015 Jan;33(1):35-44. doi: 10.1002/stem.1837. Stem Cells. 2015. PMID: 25186497 Free PMC article.
-
Monitoring and modelling the dynamics of the cellular glycolysis pathway: A review and future perspectives.Mol Metab. 2022 Dec;66:101635. doi: 10.1016/j.molmet.2022.101635. Epub 2022 Nov 12. Mol Metab. 2022. PMID: 36379354 Free PMC article. Review.
-
Direct label-free measurement of the distribution of small molecular weight compound inside thick biological tissue using coherent Raman microspectroscopy.Sci Rep. 2015 Sep 10;5:13868. doi: 10.1038/srep13868. Sci Rep. 2015. PMID: 26353981 Free PMC article.
-
Raman micro-spectroscopy reveals the spatial distribution of fumarate in cells and tissues.Nat Commun. 2024 Jun 25;15(1):5386. doi: 10.1038/s41467-024-49403-w. Nat Commun. 2024. PMID: 38918386 Free PMC article.
-
Chemical imaging of lipid droplets in muscle tissues using hyperspectral coherent Raman microscopy.Histochem Cell Biol. 2014 Mar;141(3):263-73. doi: 10.1007/s00418-013-1161-2. Epub 2013 Nov 2. Histochem Cell Biol. 2014. PMID: 24186059
References
-
- Warner, C. M., J. A. Newmark, M. Comisey, S. R. De Fazio, D. M. O'Malley, M. Rajadhyaksha, D. J. Townsend, S. McKnight, B. Roysam, P. J. Dweyer, and C. A. DiMarzio. 2004. Genetics and imaging to assess oocyte and preimplantation embryo health. Reprod. Fertil. Dev. 16:729–741. - PubMed
-
- Van Blerkom, J. 2004. Mitochondria in human oogenisis and preimplantation embryogenisis: engines of metabolism, ionic regulation and developmental competence. Reproduction. 128:269–280. - PubMed
-
- Collins, T. J., and M. D. Bootman. 2003. Mitochondria are morphologically heterogeneous within cells. J. Exp. Biol. 206:1993–2000. - PubMed
-
- Karbowski, M., and R. J. Youle. 2003. Dynamics of mitochondrial morphology in healthy cells and during apoptosis. Cell Death Differ. 10:870–880. - PubMed
Publication types
MeSH terms
Substances
Grants and funding
LinkOut - more resources
Full Text Sources
Other Literature Sources
