. 2007 Jul 15;93(2):363-72.
doi: 10.1529/biophysj.107.104091. Epub 2007 Apr 27.

Force versus axial deflection of pipette-aspirated closed membranes

Affiliations

Force versus axial deflection of pipette-aspirated closed membranes

Volkmar Heinrich et al. Biophys J. .

Abstract

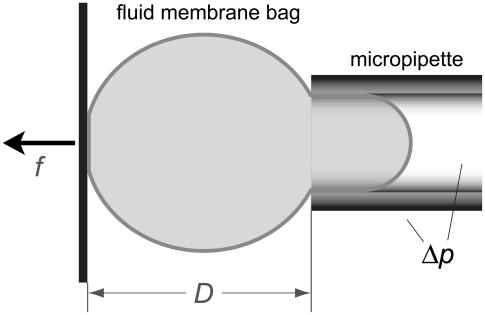
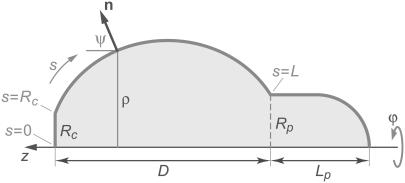
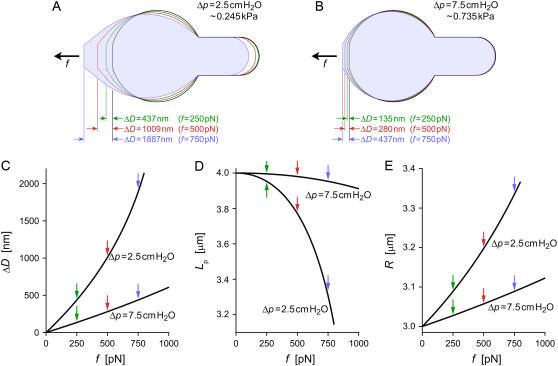
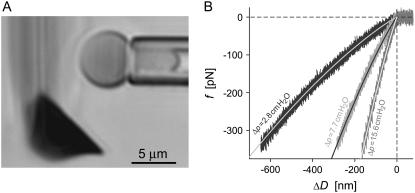
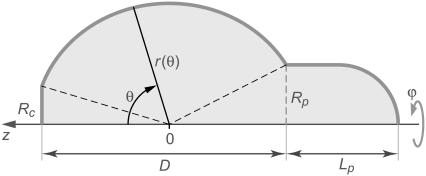
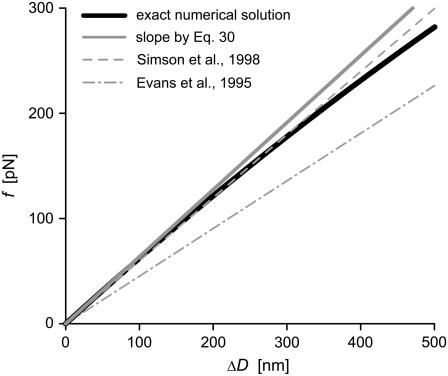
The axial deformation of a pipette-pressurized fluid membrane bag produces minuscule yet well-defined, reproducible forces. The stiffness of this ultrasensitive force transducer is tunable and largely independent of the constitutive membrane behavior. Based on a rigorous variational treatment, we present both numerical as well as approximate analytical solutions for the force-deflection relation of this unique biophysical force probe. Our numerical results predict a measurably nonlinear force-deflection behavior at moderate-to-large deformations, which we confirm experimentally using red blood cells. Furthermore, considering nearly spherical membrane shapes and enforcing proper boundary conditions, we derive an analytical solution valid at small deformations. In this linear regime the pressurized membrane bag behaves like a Hookean spring, with a spring constant that is significantly larger than previously published for the biomembrane force probe.


Figures

FIGURE 1
FIGURE 1
Sketch of a pipette-aspirated fluid membrane bag (“cell”) that is in contact with a flat surface (vertical thick solid line). The distance D between this surface and the pipette tip is adjustable, extending or compressing the cell along its symmetry axis.
FIGURE 2
FIGURE 2
Sketch defining the notation used in our numerical treatment. The angle ϕ is the azimuth of the axisymmetric arrangement; Rc is the radius of the circular contact disk, Rp the pipette radius, and Lp the projection length. For other symbols see the text.
FIGURE 3
FIGURE 3
Results of numerically modeled pulling experiments on cells with the same initial (f = 0) geometry but held at two different aspiration pressures Δp. The initial values of all geometric parameters are given in the text. (A,B) Contours of the two cells at four different pulling forces. (C) Deflection as a function of force for both cells (identified by their values of Δp). (D) Strongly nonlinear dependence of the projection length on force. (E) Radius of the constant mean curvature of the deformed cells as function of the pulling force. Colored arrows in panels CE mark the locations of the respective contours of panels A and B.
FIGURE 4
FIGURE 4
(A) Videomicrograph of a pipette-aspirated red blood cell held close to the flat side of an AFM springboard cantilever. The side view of the ∼20-μm-wide cantilever creates a blurry diffraction pattern; only the cantilever tip (dark triangular shape) appears in focus. (B) Comparison of experimentally measured force-deflection curves to numerical predictions. At each of the three indicated pressures Δp, the nearly indistinguishable results of three successive compression experiments were plotted on top of each other (noisy curves). The overlaid smooth solid lines are numerical results obtained by setting the only adjustable quantity, i.e., the cantilever stiffness at the point of contact with the cell, to k = 7.1 pN/nm.
FIGURE 5
FIGURE 5
Sketch with notation for our analytical treatment of nearly spherical shapes of the free part of the cell. The polar angle θ is the independent variable. The shape is described by the distance r from the origin. The position of the origin is set by Eq. A11 of the Appendix.
FIGURE 6
FIGURE 6
Comparison of a numerically computed force-deflection curve (same example as shown in Fig. 3 C, Δp = 2.5 cm H2O, but with reversed axes) with our linear approximation Eq. 30. Also shown are the results published previously in Evans et al. (2) and Simson et al. (3).

Comment in

Similar articles

Cited by

References

    1. Evans, E. A., R. Kwok, and T. McCown. 1980. Calibration of beam deflection produced by cellular forces in the 10−9–10−6 gram range. Cell Biophys. 2:99–112. - PubMed
    1. Evans, E., K. Ritchie, and R. Merkel. 1995. Sensitive force technique to probe molecular adhesion and structural linkages at biological interfaces. Biophys. J. 68:2580–2587. - PMC - PubMed
    1. Simson, D. A., F. Ziemann, M. Strigl, and R. Merkel. 1998. Micropipet-based pico force transducer: in depth analysis and experimental verification. Biophys. J. 74:2080–2088. - PMC - PubMed
    1. Merkel, R., P. Nassoy, A. Leung, K. Ritchie, and E. Evans. 1999. Energy landscapes of receptor-ligand bonds explored with dynamic force spectroscopy. Nature. 397:50–53. - PubMed
    1. Evans, E., A. Leung, D. Hammer, and S. Simon. 2001. Chemically distinct transition states govern rapid dissociation of single L-selectin bonds under force. Proc. Natl. Acad. Sci. USA. 98:3784–3789. - PMC - PubMed

Publication types

LinkOut - more resources