Clocking out: modeling phage-induced lysis of Escherichia coli
- PMID: 17468251
- PMCID: PMC1913442
- DOI: 10.1128/JB.00392-07
Clocking out: modeling phage-induced lysis of Escherichia coli
Erratum in
- J Bacteriol. 2007 Sep;189(17):6506
Abstract
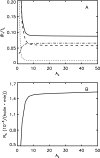
Phage lambda lyses the host Escherichia coli at a precisely scheduled time after induction. Lysis timing is determined by the action of phage holins, which are small proteins that induce hole formation in the bacterium's cytoplasmic membrane. We present a two-stage nucleation model of lysis timing, with the nucleation of condensed holin rafts on the inner membrane followed by the nucleation of a hole within those rafts. The nucleation of holin rafts accounts for most of the delay of lysis after induction. Our simulations of this model recover the accurate lysis timing seen experimentally and show that the timing accuracy is optimal. An enhanced holin-holin interaction is needed in our model to recover experimental lysis delays after the application of membrane poison, and such early triggering of lysis is possible only after the inner membrane is supersaturated with holin. Antiholin reduces the delay between membrane depolarization and lysis and leads to an earlier time after which triggered lysis is possible.
Figures


Similar articles
-
Functional analysis of heterologous holin proteins in a lambdaDeltaS genetic background.FEMS Microbiol Lett. 2000 Mar 15;184(2):179-86. doi: 10.1111/j.1574-6968.2000.tb09011.x. FEMS Microbiol Lett. 2000. PMID: 10713418
-
Topological dynamics of holins in programmed bacterial lysis.Proc Natl Acad Sci U S A. 2006 Dec 26;103(52):19713-8. doi: 10.1073/pnas.0600943103. Epub 2006 Dec 15. Proc Natl Acad Sci U S A. 2006. PMID: 17172454 Free PMC article.
-
A Cytoplasmic Antiholin Is Embedded In Frame with the Holin in a Lactobacillus fermentum Bacteriophage.Appl Environ Microbiol. 2018 Mar 1;84(6):e02518-17. doi: 10.1128/AEM.02518-17. Print 2018 Mar 15. Appl Environ Microbiol. 2018. PMID: 29305511 Free PMC article.
-
Holin of bacteriophage lambda: structural insights into a membrane lesion.Mol Microbiol. 2008 Aug;69(4):781-3. doi: 10.1111/j.1365-2958.2008.06335.x. Epub 2008 Jun 28. Mol Microbiol. 2008. PMID: 18573181 Review.
-
[Current advance in the topological structure and function of holin encoded by bacteriophage lambda--a review].Wei Sheng Wu Xue Bao. 2012 Feb 4;52(2):141-5. Wei Sheng Wu Xue Bao. 2012. PMID: 22586990 Review. Chinese.
Cited by
-
The temperate Burkholderia phage AP3 of the Peduovirinae shows efficient antimicrobial activity against B. cenocepacia of the IIIA lineage.Appl Microbiol Biotechnol. 2017 Feb;101(3):1203-1216. doi: 10.1007/s00253-016-7924-7. Epub 2016 Oct 21. Appl Microbiol Biotechnol. 2017. PMID: 27770178 Free PMC article.
-
The autolysin LytA contributes to efficient bacteriophage progeny release in Streptococcus pneumoniae.J Bacteriol. 2009 Sep;191(17):5428-40. doi: 10.1128/JB.00477-09. Epub 2009 Jul 6. J Bacteriol. 2009. PMID: 19581370 Free PMC article.
-
Conformational free energy landscape of a glutamate transporter and microscopic details of its transport mechanism.Proc Natl Acad Sci U S A. 2025 Mar 11;122(10):e2416381122. doi: 10.1073/pnas.2416381122. Epub 2025 Mar 5. Proc Natl Acad Sci U S A. 2025. PMID: 40042900
-
Bioinformatic characterization of endolysins and holin-like membrane proteins in the lysis cassette of phages that infect Gordonia rubripertincta.PLoS One. 2022 Nov 17;17(11):e0276603. doi: 10.1371/journal.pone.0276603. eCollection 2022. PLoS One. 2022. PMID: 36395171 Free PMC article.
-
Biological Characterization and Evolution of Bacteriophage T7-△holin During the Serial Passage Process.Front Microbiol. 2021 Aug 2;12:705310. doi: 10.3389/fmicb.2021.705310. eCollection 2021. Front Microbiol. 2021. PMID: 34408735 Free PMC article.
References
-
- Avron, J. E., H. van Beijeren, L. S. Schulman, and R. K. P. Zia. 1982. Roughening transition, surface tension and equilibrium droplet shapes in a two-dimensional Ising system. J. Phys. A 15:L81-L86.
-
- Bowie, J. U. 1997. Helix packing in membrane proteins. J. Mol. Bacteriol. 272:780-789. - PubMed
-
- Bray, A. J. 2002. Theory of phase-ordering kinetics. Adv. Phys. 51:481-587.
-
- Brogden, K. A. 2005. Antimicrobial peptides: pore formers or metabolic inhibitors in bacteria? Nat. Rev. Microbiol. 3:238-250. - PubMed
Publication types
MeSH terms
Substances
LinkOut - more resources
Full Text Sources

