. 2007 Apr;19(4):1251-64.
doi: 10.1105/tpc.106.048355. Epub 2007 Apr 27.

Plant mitochondrial recombination surveillance requires unusual RecA and MutS homologs

Affiliations

Plant mitochondrial recombination surveillance requires unusual RecA and MutS homologs

Vikas Shedge et al. Plant Cell. 2007 Apr.

Abstract

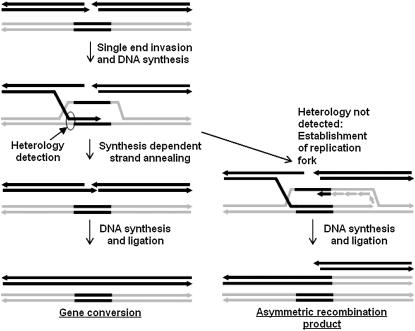
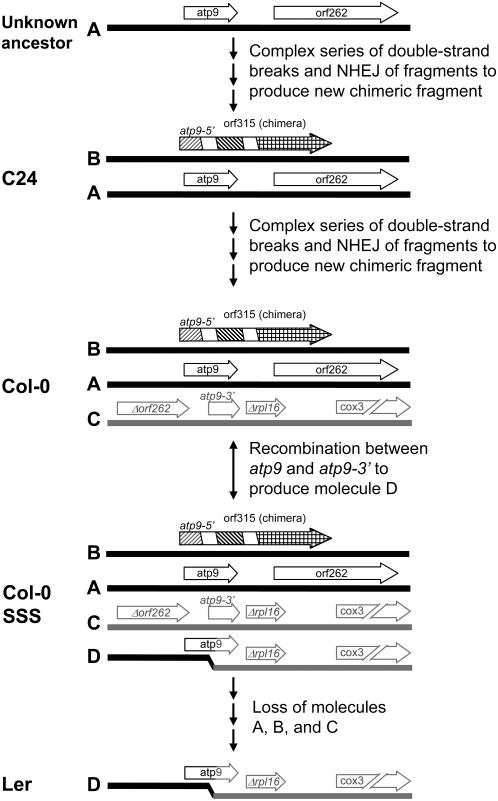
For >20 years, the enigmatic behavior of plant mitochondrial genomes has been well described but not well understood. Chimeric genes appear, and occasionally are differentially replicated or expressed, with significant effects on plant phenotype, most notably on male fertility, yet the mechanisms of DNA replication, chimera formation, and recombination have remained elusive. Using mutations in two important genes of mitochondrial DNA metabolism, we have observed reproducible asymmetric recombination events occurring at specific locations in the mitochondrial genome. Based on these experiments and existing models of double-strand break repair, we propose a model for plant mitochondrial DNA replication, chimeric gene formation, and the illegitimate recombination events that lead to stoichiometric changes. We also address the physiological and developmental effects of aberrant events in mitochondrial genome maintenance, showing that mitochondrial genome rearrangements, when controlled, influence plant reproduction, but when uncontrolled, lead to aberrant growth phenotypes and dramatic reduction of the cell cycle.


Figures

Figure 1.
Figure 1.
Protein Sequence Alignment of the Three Organellar Arabidopsis RECA Proteins along with RecA from E. coli (GI:67471975). Identical residues in all four are indicated by gray shading, and residues that are similar are indicated in light gray. Notable differences between RECA3 and the others are indicated by black shading and include the following changes in highly conserved motifs: (1) substitution of a Lys for a conserved Pro residue in the ATP binding/hydrolyzing P-loop, (2) a Lys-to-Pro substitution in the RecA signature motif involved in monomer–monomer interaction, and (3) a C-terminal deletion of the region of negatively charged residues that have been shown to be important in RecA strand exchange activity.
Figure 2.
Figure 2.
Subcellular Localization of Arabidopsis RECA Proteins by Particle Bombardment of Targeting Presequence-GFP Fusions in Young Arabidopsis Leaf Cells. DNA fragments representing the first 80 codons of each gene were amplified from genomic DNA and inserted into the binary vector pK7FWG2 (Karimi et al., 2002). These constructs were analyzed by particle bombardment of Arabidopsis leaves and confocal microscopy. Representative GFP-containing mitochondria are indicated by white arrows and the GFP-containing plastids by yellow arrows.
Figure 3.
Figure 3.
Analysis of Asymmetric Recombination Associated with SSS. (A) Predominant recombination events in recA3-1 and msh1-1 mutant plants. BamHI sites are indicated by vertical lines. The blot was hybridized with a probe spanning atp9 and Δrpl16 from molecule D (indicated as Probe 1). Dashed arrows indicate the BamHI fragments corresponding to the bands on the DNA gel blot. Molecules A and B are derived from the published sequence of the Arabidopsis ecotype C24 sequence (accession number NC_001284) (Unseld et al., 1997). The BamHI sites in molecule A are found at positions 278381 and 280053 and those in molecule B are at positions 20236 and 17037. Molecule C is derived from the sequence of BAC T17H1 (accession number AC007143) originating in ecotype Col-0 and also described by Forner et al. (2005). The BamHI sites are located at positions 57709 and 56613 in BAC T17H1. Molecule D is the result of recombination between molecules A and C anywhere in the 249 bp of identity in the 3′ region of atp9 and has been described by Sakamoto et al. (1996), although their explanation of the origin of this fragment was incorrect because they were not aware of molecule C. Molecule E is predicted by in silico recombination of molecules A and B within the 335-bp identity in the 5′ end of atp9. (B) Additional hybridization analysis of the bands indicated in (A). BamHI digests were blotted and hybridized with probes representing the 5′ and 3′ ends of the atp9 gene, indicated as Probes 2 and 3 in (A). As expected, the 1.10-kb band does not hybridize to the 5′ end probe, and the 3.20- and 1.26-kb bands do not hybridize to the 3′ end probe.
Figure 4.
Figure 4.
The Nature of recA3 Phenotype Reversibility. (A) Mitochondrial SSS mediated by msh1-1. The pollen parent is indicated to the right. SSS was detected using a PCR-based assay as previously described (Sakamoto et al., 1996). A single forward primer is located in the 5′ end of the atp9 gene. Two different reverse primers were used: one in orf262 and the other in Δrpl16. The top 748-bp band corresponds to the amplification product from molecule A, and the bottom 649-bp band corresponds to the amplification product from molecule D. (B) Mitochondrial SSS mediated by recA3-1. The PCR assay was as in (A). (C) Recombinant molecules in recA3-1 mutants before and after pollination by the wild type. BamHI digests are hybridized with Probe 1 from Figure 3A; rr indicates homozygous recA3-1 mutants, while the two lanes marked Rr represent separate progeny from pollination of recA3-1/recA3-1 plants with RECA3/RECA3 pollen. Molecules A and C are identical to those shown in Figure 3A. Crossing over between molecules A and C in recA3-1 mutant plants results in accumulation of molecule D (as also seen in Figure 3A). The reciprocal recombinant is molecule F. The panel on the right is a separate experiment confirming that the 1.22-kb band seen in recA3-1 mutants (molecule F) is distinct from the 1.26-kb band (molecule E) previously seen in msh1-1 mutants. (D) DNA gel blot analysis of different recA3-1/recA3-1 plants. BamHI digestion, blotting, and hybridizations were as in (C). Plants with higher stoichiometry of molecule D are indicated by asterisks.
Figure 5.
Figure 5.
Expression of RECA3 and MSH1. Quantitative real-time RT-PCR analysis of RECA3 and MSH1 gene expression. Levels of RNA in the tissues indicated were assayed as described by Livak and Schmittgen (2001), using ubiquitin as an internal standard. Tissues were taken from 6-week-old plants. The data represent means of four replicates ± SE.
Figure 6.
Figure 6.
Dual Distribution of MshI and RecA3 Conditions a Distinct Phenotype. (A) Phenotype of msh1-1/msh1-1, recA3-1/recA3-1, and double mutant plants. Eight-week-old plants are shown. Col-0, recA3-1/recA3-1, msh1-1/msh1-1, and recA3-1 msh1-1/recA3-1 msh1-1 double mutant plants were planted together and grown under identical conditions. (B) Mitotic index determination. Two median longitudinal sections per root and two roots per group were examined. Mitotic profiles were recorded for root apical meristem within 80 μm. The mean mitotic indices are shown and were 7.75% for Col-0 (i), 4.75% for msh1 (ii), 5.5% for recA3 (iii), and 0.75% for the double mutant (iv). Bar = 10 μm. (C) Abnormal flower morphology of recA3 msh1 double mutant plants. The stigma appears to be developed and receptive before the pollen matures. Fewer pollen grains are seen in the double mutants than in Col-0.
Figure 7.
Figure 7.
DNA Gel Blot Analysis of the Double Mutant. BamHI digests of DNA from Col-0 and from homozygous recA3, msh1, and double mutant plants were blotted and hybridized with Probe 2 from Figure 3A. Two different double mutant plants are shown. Arrows indicate stoichiometric differences in the double mutant compared with either of the single mutants.
Figure 8.
Figure 8.
Model for Outcomes of Double-Strand Breaks at Short Repeats. Two different molecules are indicated in black and red, with a segment of the black molecule repeated within the red. Invasion of the 3′ end to form a D loop, and extension by DNA polymerase leads to two possibilities. Rejection of the invading strand from the D loop and annealing to the other broken end will result in gene conversion. A replication fork could also form at the D loop, resulting in asymmetric recombination.
Figure 9.
Figure 9.
Hypothetical Pathway Leading to Different Genomic Molecules in the Different Ecotypes. At the top is indicated a hypothetical ancestral mitochondrial genome containing only molecule A (labels are the same as in Figures 3 and 4C) containing the atp9 gene and orf262. A series of complex breaking and rejoining events results in molecule B, containing the chimeric gene known as orf315. This is the configuration found in ecotype C24. A further series of complex rearrangements results in molecule C, the configuration found in Col-0. Recombination between molecules B and C occurs to produce molecule D, a configuration indicated as Col-0 SSS. This configuration may occur spontaneously or reproducibly in the recA3 and msh1 mutants. This configuration is also reversible. Molecule D now includes a fully functional copy of the atp9 gene, so loss of molecule A will not be lethal. Loss of molecules A, B, and C results in the configuration seen in ecotype Ler.

Similar articles

Cited by

References

    1. Abad, A.R., Mehrtens, B.J., and Mackenzie, S.A. (1995). Specific expression in reproductive tissues and fate of a mitochondrial sterility-associated protein in cytoplasmic male-sterile bean. Plant Cell 7 271–285. - PMC - PubMed
    1. Abdelnoor, R., Christensen, A., Mohammed, S., Munoz-Castillo, B., Moriyama, H., and Mackenzie, S. (2006). Mitochondrial genome dynamics in plants and animals: Convergent gene fusions of a MutS homologue. J. Mol. Evol. 63 165–173. - PubMed
    1. Abdelnoor, R.V., Yule, R., Elo, A., Christensen, A.C., Meyer-Gauen, G., and Mackenzie, S.A. (2003). Substoichiometric shifting in the plant mitochondrial genome is influenced by a gene homologous to MutS. Proc. Natl. Acad. Sci. USA 100 5968–5973. - PMC - PubMed
    1. Adams, K., and Palmer, J. (2003). Evolution of mitochondrial gene content: Gene loss and transfer to the nucleus. Mol. Phylogenet. Evol. 29 380–395. - PubMed
    1. Aguilera, A. (2001). Double-strand break repair: Are Rad51/RecA–DNA joints barriers to DNA replication? Trends Genet. 17 318–321. - PubMed

Publication types

MeSH terms

LinkOut - more resources