

Evolutionary rates vary among rRNA structural elements
- PMID: 17468501
- PMCID: PMC1904297
- DOI: 10.1093/nar/gkm101
Evolutionary rates vary among rRNA structural elements
Abstract
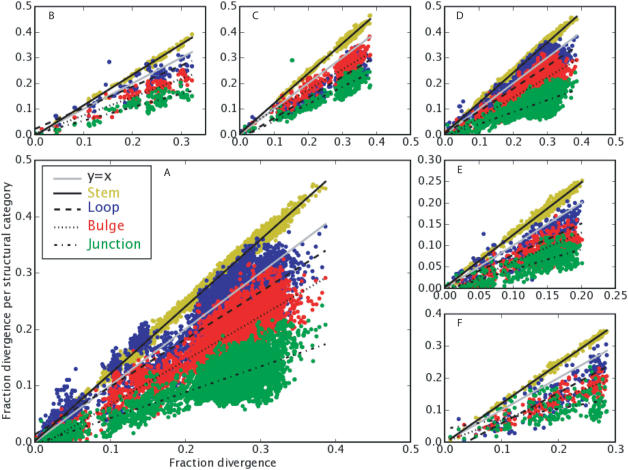
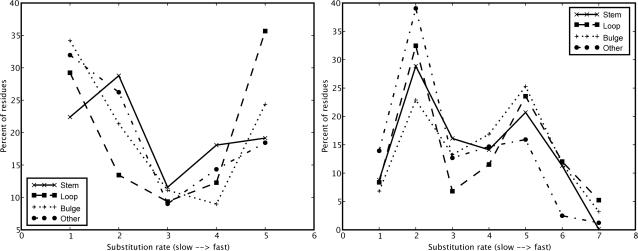
Understanding patterns of rRNA evolution is critical for a number of fields, including structure prediction and phylogeny. The standard model of RNA evolution is that compensatory mutations in stems make up the bulk of the changes between homologous sequences, while unpaired regions are relatively homogeneous. We show that considerable heterogeneity exists in the relative rates of evolution of different secondary structure categories (stems, loops, bulges, etc.) within the rRNA, and that in eukaryotes, loops actually evolve much faster than stems. Both rates of evolution and abundance of different structural categories vary with distance from functionally important parts of the ribosome such as the tRNA path and the peptidyl transferase center. For example, fast-evolving residues are mainly found at the surface; stems are enriched at the subunit interface, and junctions near the peptidyl transferase center. However, different secondary structure categories evolve at different rates even when these effects are accounted for. The results demonstrate that relative rates and patterns of evolution are lineage specific, suggesting that phylogenetically and structurally specific models will improve evolutionary and structural predictions.
Figures


Similar articles
-
Evolution of the ribosome at atomic resolution.Proc Natl Acad Sci U S A. 2014 Jul 15;111(28):10251-6. doi: 10.1073/pnas.1407205111. Epub 2014 Jun 30. Proc Natl Acad Sci U S A. 2014. PMID: 24982194 Free PMC article.
-
Periodic conformational changes in rRNA: monitoring the dynamics of translating ribosomes.Mol Cell. 2000 Jul;6(1):159-71. Mol Cell. 2000. PMID: 10949037
-
rRNA modifications and ribosome function.Trends Biochem Sci. 2002 Jul;27(7):344-51. doi: 10.1016/s0968-0004(02)02109-6. Trends Biochem Sci. 2002. PMID: 12114023
-
RNA structure: reading the ribosome.Science. 2005 Sep 2;309(5740):1508-14. doi: 10.1126/science.1111771. Science. 2005. PMID: 16141058 Review.
-
Carl Woese: a structural biologist's perspective.RNA Biol. 2014;11(3):172-4. doi: 10.4161/rna.27428. Epub 2013 Dec 20. RNA Biol. 2014. PMID: 24598315 Free PMC article. Review.
Cited by
-
The Structural Determinants of Intra-Protein Compensatory Substitutions.Mol Biol Evol. 2022 Apr 11;39(4):msac063. doi: 10.1093/molbev/msac063. Mol Biol Evol. 2022. PMID: 35349721 Free PMC article.
-
18S rRNA is a reliable normalisation gene for real time PCR based on influenza virus infected cells.Virol J. 2012 Oct 8;9:230. doi: 10.1186/1743-422X-9-230. Virol J. 2012. PMID: 23043930 Free PMC article.
-
Compositional properties and thermal adaptation of 18S rRNA in vertebrates.RNA. 2008 Aug;14(8):1492-500. doi: 10.1261/rna.957108. Epub 2008 Jun 20. RNA. 2008. PMID: 18567811 Free PMC article.
-
RNASTAR: an RNA STructural Alignment Repository that provides insight into the evolution of natural and artificial RNAs.RNA. 2012 Jul;18(7):1319-27. doi: 10.1261/rna.032052.111. Epub 2012 May 29. RNA. 2012. PMID: 22645380 Free PMC article.
-
Basin Hopping Graph: a computational framework to characterize RNA folding landscapes.Bioinformatics. 2014 Jul 15;30(14):2009-17. doi: 10.1093/bioinformatics/btu156. Epub 2014 Mar 19. Bioinformatics. 2014. PMID: 24648041 Free PMC article.
References
-
- Fox GE, Woese CR. The architecture of 5S rRNA and its relation to function. J. Mol. Evol. 1975;6:61–76. - PubMed
-
- Noller HF, Hoffarth V, Zimniak L. Unusual resistance of peptidyl transferase to protein extraction procedures. Science. 1992;256:1416–1419. - PubMed
-
- Gilbert W. Origin of life: the RNA world. Nature. 1986;319:618.
-
- Welch M, Majerfeld I, Yarus M. 23S rRNA similarity from selection for peptidyl transferase mimicry. Biochemistry. 1997;36:6614–6623. - PubMed
