

Role for histone deacetylase 1 in human tumor cell proliferation
- PMID: 17470557
- PMCID: PMC1951481
- DOI: 10.1128/MCB.00494-07
Role for histone deacetylase 1 in human tumor cell proliferation
Abstract
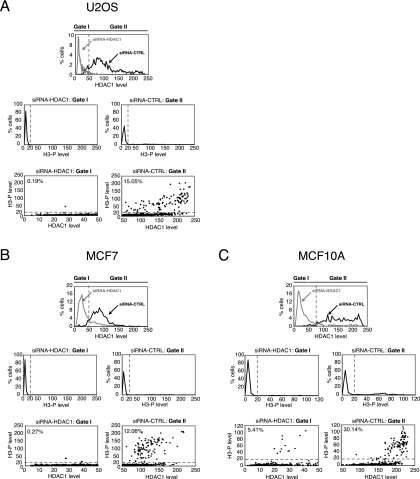
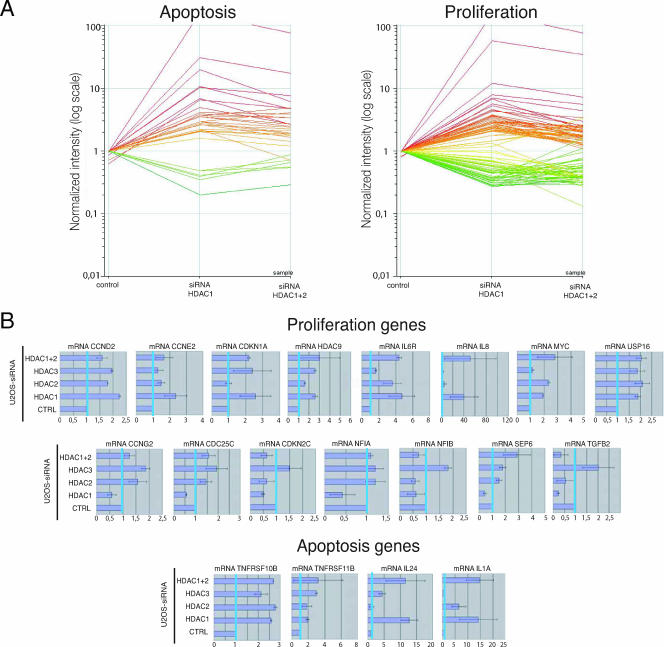
Posttranslational modifications of core histones are central to the regulation of gene expression. Histone deacetylases (HDACs) repress transcription by deacetylating histones, and class I HDACs have a crucial role in mouse, Xenopus laevis, zebra fish, and Caenorhabditis elegans development. The role of individual class I HDACs in tumor cell proliferation was investigated using RNA interference-mediated protein knockdown. We show here that in the absence of HDAC1 cells can arrest either at the G(1) phase of the cell cycle or at the G(2)/M transition, resulting in the loss of mitotic cells, cell growth inhibition, and an increase in the percentage of apoptotic cells. On the contrary, HDAC2 knockdown showed no effect on cell proliferation unless we concurrently knocked down HDAC1. Using gene expression profiling analysis, we found that inactivation of HDAC1 affected the transcription of specific target genes involved in proliferation and apoptosis. Furthermore, HDAC2 downregulation did not cause significant changes compared to control cells, while inactivation of HDAC1, HDAC1 plus HDAC2, or HDAC3 resulted in more distinct clusters. Loss of these HDACs might impair cell cycle progression by affecting not only the transcription of specific target genes but also other biological processes. Our data support the idea that a drug targeting specific HDACs could be highly beneficial in the treatment of cancer.
Figures


Similar articles
-
Negative and positive regulation of gene expression by mouse histone deacetylase 1.Mol Cell Biol. 2006 Nov;26(21):7913-28. doi: 10.1128/MCB.01220-06. Epub 2006 Aug 28. Mol Cell Biol. 2006. PMID: 16940178 Free PMC article.
-
Type-specific roles of histone deacetylase (HDAC) overexpression in ovarian carcinoma: HDAC1 enhances cell proliferation and HDAC3 stimulates cell migration with downregulation of E-cadherin.Int J Cancer. 2010 Sep 1;127(6):1332-46. doi: 10.1002/ijc.25151. Int J Cancer. 2010. PMID: 20049841
-
Inhibition of histone deacetylase 2 increases apoptosis and p21Cip1/WAF1 expression, independent of histone deacetylase 1.Cell Death Differ. 2005 Apr;12(4):395-404. doi: 10.1038/sj.cdd.4401567. Cell Death Differ. 2005. PMID: 15665816
-
Histone deacetylases and cancer.Oncogene. 2007 Aug 13;26(37):5420-32. doi: 10.1038/sj.onc.1210610. Oncogene. 2007. PMID: 17694083 Review.
-
HDAC1 and HDAC2 in mouse oocytes and preimplantation embryos: Specificity versus compensation.Cell Death Differ. 2016 Jul;23(7):1119-27. doi: 10.1038/cdd.2016.31. Epub 2016 Apr 15. Cell Death Differ. 2016. PMID: 27082454 Free PMC article. Review.
Cited by
-
Multiple roles of class I HDACs in proliferation, differentiation, and development.Cell Mol Life Sci. 2012 Jul;69(13):2173-87. doi: 10.1007/s00018-012-0921-9. Cell Mol Life Sci. 2012. PMID: 22286122 Free PMC article. Review.
-
Histone deacetylase turnover and recovery in sulforaphane-treated colon cancer cells: competing actions of 14-3-3 and Pin1 in HDAC3/SMRT corepressor complex dissociation/reassembly.Mol Cancer. 2011 May 30;10:68. doi: 10.1186/1476-4598-10-68. Mol Cancer. 2011. PMID: 21624135 Free PMC article.
-
Transcription and beyond: the role of mammalian class I lysine deacetylases.Chromosoma. 2014 Mar;123(1-2):67-78. doi: 10.1007/s00412-013-0441-x. Epub 2013 Oct 30. Chromosoma. 2014. PMID: 24170248 Free PMC article. Review.
-
Histone deacetylase 1 is required for exocrine pancreatic epithelial proliferation in development and cancer.Cancer Biol Ther. 2011 Apr 1;11(7):659-70. doi: 10.4161/cbt.11.7.14720. Epub 2011 Apr 1. Cancer Biol Ther. 2011. PMID: 21301206 Free PMC article.
-
Targeting Histone Deacetylases with Natural and Synthetic Agents: An Emerging Anticancer Strategy.Nutrients. 2018 Jun 6;10(6):731. doi: 10.3390/nu10060731. Nutrients. 2018. PMID: 29882797 Free PMC article. Review.
References
-
- Ahringer, J. 2000. NuRD and SIN3 histone deacetylase complexes in development. Trends Genet. 16:351-356. - PubMed
-
- Alcalay, M., N. Meani, V. Gelmetti, A. Fantozzi, M. Fagioli, A. Orleth, D. Riganelli, C. Sebastiani, E. Cappelli, C. Casciari, M. T. Sciurpi, A. R. Mariano, S. P. Minardi, L. Luzi, H. Muller, P. P. Di Fiore, G. Frosina, and P. G. Pelicci. 2003. Acute myeloid leukemia fusion proteins deregulate genes involved in stem cell maintenance and DNA repair. J. Clin. Investig. 112:1751-1761. - PMC - PubMed
-
- Bolden, J. E., M. J. Peart, and R. W. Johnstone. 2006. Anticancer activities of histone deacetylase inhibitors. Nat. Rev. Drug Discov. 5:769-784. - PubMed
Publication types
MeSH terms
Substances
LinkOut - more resources
Full Text Sources
Other Literature Sources
Miscellaneous