. 2007 May 7;177(3):489-500.
doi: 10.1083/jcb.200608093. Epub 2007 Apr 30.

Vascular endothelial growth factor can signal through platelet-derived growth factor receptors

Affiliations

Vascular endothelial growth factor can signal through platelet-derived growth factor receptors

Stephen G Ball et al. J Cell Biol. .

Abstract

Vascular endothelial growth factor (VEGF-A) is a crucial stimulator of vascular cell migration and proliferation. Using bone marrow-derived human adult mesenchymal stem cells (MSCs) that did not express VEGF receptors, we provide evidence that VEGF-A can stimulate platelet-derived growth factor receptors (PDGFRs), thereby regulating MSC migration and proliferation. VEGF-A binds to both PDGFRalpha and PDGFRbeta and induces tyrosine phosphorylation that, when inhibited, results in attenuation of VEGF-A-induced MSC migration and proliferation. This mechanism was also shown to mediate human dermal fibroblast (HDF) migration. VEGF-A/PDGFR signaling has the potential to regulate vascular cell recruitment and proliferation during tissue regeneration and disease.


Figures
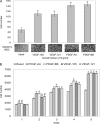
Figure 1.
Figure 1.
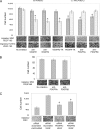
Exposure to VEGF-A increased MSC migration and proliferation. (A) MSC migration was examined in serum-free conditions after a 5-h exposure to a growth factor; 10 ng/ml VEGF-A165, VEGF-A121, PDGF-AA, or PDGF-BB in the lower half of a Boyden chamber. Basal represents growth factor–independent migration. Images below each bar graph are representative of migratory cells/field (using a 10× objective lens) on the membrane underside. Data shown are the mean number of migratory cells ± the SD determined from 10 random fields from each of four independent experiments. *, P < 0.001, compared with basal migration. (B) MSC proliferation was determined over a 5-d period after incubation with growth medium supplemented with fresh growth factor; 10 ng/ml VEGF-A165, VEGF-A121, PDGF-AA, or PDGF-BB every 24 h. Basal represents proliferation independent of supplemented growth factors. Data shown are the mean cell number ± the SD determined from triplicate assays from each of two independent experiments. *, P < 0.001; #, P < 0.005 compared with the respective basal cell proliferation.
Figure 2.
Figure 2.
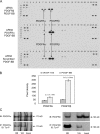
MSCs expressed no VEGFRs. The expression of VEGFR mRNA transcripts was examined by semiquantitative RT-PCR analysis and cell surface protein expression by single-color flow cytometry, using human MSCs, HUVECs as a VEGFR-positive control cell, and HDF as a VEGFR-negative control cell. (A) RNA isolated from MSCs, HUVECs, and HDFs were used to amplify VEGFR1-3, VEGF-A, NP-1, and NP-2 transcripts, with GAPDH as a control, and then resolved by agarose gel. Lane 1, VEGFR1 (99 bp); lane 2, VEGFR2 (81 bp); lane 3, VEGFR3 (87 bp); lane 4, VEGF-A (98 bp); lane 5, GAPDH (71 bp); lane 6, NP-1 (77 bp); lane 7, NP-2 (83 bp). Data are representative of six independent experiments, with two different pairs of primers for VEGFR1-3 used. (B) Flow cytometry using PE-conjugated antibodies. Analysis of VEGFR1-3 is represented by VEGFR1-, VEGFR2-, and VEGFR3-PE expression, respectively, with IgG1-PE expression as a control. A representative example of three independent experiments is shown.
Figure 3.
Figure 3.
Inhibiting PDGFRα or PDGFRβ attenuated VEGF-A–induced MSC migration. (A) MSCs, or HUVECs used as a VEGFR- positive cell, were pretreated with either 10 μg/ml anti-VEGFR1 or -VEGFR2 neutralization antibodies, 100 nM VEGFR2 tyrosine kinase inhibitor (VEGFR2-TK), 2 μM PDGFR tyrosine kinase inhibitor (PDGFR-TK), and 10 μg/ml anti-PDGFRα or -PDGFRβ neutralization antibodies; then, either 10 ng/ml VEGF-A165 or 10 ng/ml VEGF-A121 (not depicted) were added to the lower half of a Boyden chamber for 5 h. No inhibition represents control VEGF-A–induced migration. (B) As a control, MSCs were pretreated with either 10 μg/ml anti-PDGFRα or -PDGFRβ neutralization antibodies, and then 10 ng/ml PDGF-BB was added to the lower half of a Boyden chamber for 5 h. No inhibition represents control PDGF-BB–induced migration. (C) MSCs were transfected with either 3 μg siRNA PDGFRα, siRNA PDGFRβ, or scrambled siRNA used as a control. Transfected MSCs in serum-free conditions were either unstimulated as a control, or exposed to 10 ng/ml VEGF-A165 in the lower half of a Boyden chamber for 5 h. Images below each bar graph are representative of migratory cells/field (using a 10× objective lens) on the membrane underside. Data shown are the mean number of migratory cells ± the SD, which were determined from 10 random fields from each of four (A) or two (B and C) independent experiments. *, P < 0.001, compared with the respective uninhibited VEGF-A165–stimulated cells.
Figure 4.
Figure 4.
VEGF-A–induced HDF migration was PDGFRα and PDGFRβ dependent. (A) The expression of cell surface PDGFRs on HDFs were determined by single-color flow cytometry. Analysis of PDGFRα and PDGFRβ was performed using anti–human PE-conjugated antibodies, using an IgG1-PE antibody as a control. (B) The effects of VEGF-A on HDF migration and the involvement of PDGFRs were examined using Boyden chamber migration assays. HDF migration was evaluated in serum-free conditions after 5-h exposure to growth factor; 20 ng/ml VEGF-A165, VEGF-A121, PDGF-AA, or PDGF-BB in the lower half of a Boyden chamber. Basal represents growth factor–independent migration. (C) HDFs were pretreated with either 10 μg/ml anti-PDGFRα or -PDGFRβ neutralization antibodies, before adding 20 ng/ml VEGF-A165 to the lower half of a Boyden chamber for 5 h. No inhibition represents control VEGF-A165–induced migration. (D) HDFs were transfected with either 3 μg siRNA PDGFRα, siRNA PDGFRβ, or scrambled siRNA used as a control. Transfected HDFs in serum-free conditions were either unstimulated as a control, or exposed to 20 ng/ml VEGF-A165 in the lower half of a Boyden chamber for 5 h. Images below each bar graph are representative of migratory cells/field (using a 10× objective lens) on the underside of the membrane. Data shown are the mean number of migratory cells ± the SD determined from 10 random fields from each of three independent experiments. *, P < 0.001, compared with the respective uninhibited VEGF-A165 or PDGF-stimulated cells.
Figure 5.
Figure 5.
VEGF-A stimulated both PDGFRα and PDGFRβ tyrosine phosphorylation. Human phospho-RTK arrays were used to examine VEGF-A–induced RTK phosphorylation levels in MSC lysate samples. Arrays contain phosphotyrosine-positive control spots in each corner, having coordinates (A1, A2), (A23, A24), (F1, F2), (F23, F24), which were assigned a pixel density value of 100, which was used to normalize positive RTK spot pixel density values. Relevant RTK duplicate spot coordinates: PDGFRα = (C7, C8), PDGFRβ = (C9, C10), VEGFR1 = (D9, D10), VEGFR2 = (D11, D12), VEGFR3 = (D13, D14), EGFR = (B1, B2), FGFR3 = (B13, B14), Axl = (B21, B22), EphA7 = (E3, E4). (A) RTK array analysis of control MSC lysate, not stimulated with exogenous growth factor (basal). (B) RTK array analysis of lysates from MSCs transfected with 3 μg scrambled siRNA as a control, siRNA PDGFRα or siRNA PDGFRβ, stimulated using 20 ng/ml VEGF-A165 in serum-free conditions for 10 min at 37°C. Each array was identically exposed to detection reagents and film. (C) Bar graph representing data from arrays (A and B). Mean pixel density ± the SD of duplicate spots, normalized against duplicate phosphotyrosine-positive control spots = 100. A representative example of two independent experiments is shown for each array analysis. *, P < 0.001 compared with the respective VEGF-A165–stimulated scrambled siRNA control.
Figure 6.
Figure 6.
VEGF-A–induced PDGFR tyrosine phosphorylation was comparable to PDGF-BB–induced PDGFRα level. (A) RTK array analysis of lysates from MSCs transfected with 3 μg scrambled siRNA as a control, siRNA PDGFRα or siRNA PDGFRβ, stimulated using 20 ng/ml PDGF-BB in serum-free conditions for 10 min at 37°C. Each array was identically exposed to detection reagents and film. A representative example of two independent experiments is shown. (B) Bar graph comparing VEGF-A165– and PDGF-BB–induced PDGFR tyrosine phosphorylation levels. Data represent VEGF-A165 and PDGF-BB–stimulated controls from RTK array analysis shown in Fig. 5 B and Fig. 6 A, respectively. Mean pixel density ± the SD of duplicate spots, normalized against duplicate phosphotyrosine-positive control spots = 100. (C) Immunoprecipitation (IP) analysis of PDGFR tyrosine phosphorylation levels. MSCs in serum-free conditions were unstimulated with growth factor (basal), or stimulated with either 20 ng/ml VEGF-A165 or PDGF-BB as a control, for 10 min at 37°C. PDGFRs were isolated from MSC lysates by IP analysis using anti-PDGFRα or anti-PDGFRβ, and then tyrosine phosphorylation detected by immunoblot (IB) analysis using anti-phosphotyrosine (Tyr-P). Membranes were reprobed with corresponding anti-PDGFRα or anti-PDGFRβ as loading controls. A representative of two independent experiments is shown.
Figure 7.
Figure 7.
VEGF-A induced a dose-dependent increase in PDGFR tyrosine phosphorylation. The effects of varying VEGF-A165 concentration on induced PDGFR tyrosine phosphorylation levels was determined by specific ELISAs. MSCs in serum-free conditions were exposed to 0.5, 1, 2, 5, 10, 25, 50, 100, or 200 ng/ml VEGF-A165 for 10 min at 37°C. As a control, cells were also exposed to identical concentrations of PDGF-BB. MSC lysates were assayed for either PDGFRα or PDGFRβ tyrosine phosphorylation using a corresponding ELISA. Increased tyrosine phosphorylation is represented by an increase in optical density (OD450nm). Data shown are mean OD450nm ± the SD determined from two independent experiments performed in triplicate.
Figure 8.
Figure 8.
VEGF-A associated with both PDGFRα and PDGFRβ. Binding of VEGF-A to either PDGFRα or PDGFRβ was examined using a cross-linking approach. MSCs were unstimulated (basal) or stimulated with either 10 ng/ml VEGF-A165 (165) or PDGF-BB (BB) as a positive control, or 10 ng/ml TGF-β1 as a negative control (not depicted), for 10 min at 37°C. To inhibit growth factor binding to the respective PDGFR, MSCs were also pretreated with either 10 μg/ml anti-PDGFRα (Rα) or -PDGFRβ (Rβ) cell surface neutralization antibodies for 30 min at 37°C, before growth factor stimulation. Growth factor binding to PDGFR was captured by adding 1 mM of a cell membrane–impermeable cross-linking agent (DTSSP), followed by immunoprecipitation (IP) analysis using anti-PDGFRα or anti-PDGFRβ, then growth factor association detected by immunoblot (IB) analysis using corresponding (A) anti–VEGF-A or (B) –PDGF-B. Membranes were reprobed with anti-PDGFRα or -PDGFRβ as loading controls. A representative of three independent experiments is shown for each analysis.
Figure 9.
Figure 9.
PDGF-induced MSC migration was inhibited by VEGF-A. The effects of VEGF-A on PDGF-induced MSC migration was examined using Boyden chamber migration assays. MSCs were preincubated with 10 ng/ml VEGF-A165 for 10 min, before adding the cell suspension onto the upper chamber membrane surface and exposure to 10 ng/ml PDGF-AA or -BB in the lower half of a Boyden chamber for 5 h. MSCs not exposed to either growth factor represents a growth factor–independent migration control. Images below each bar graph are representative of migratory cells/field (using a 10× objective lens) on the membrane underside. Data shown are the mean number migratory cells ± the SD determined from 10 random fields from each of two independent experiments. *, P < 0.001 compared with the respective migration induced by PDGF alone.

References

    1. Abedin, M., Y. Tintut, and L. Demer. 2004. Mesenchymal stem cells and the artery wall. Circ. Res. 95:671–676. - PubMed
    1. Aghi, M., and E.A. Chiocca. 2005. Contribution of bone marrow-derived cells to blood vessels in ischemic tissues and tumors. Mol. Ther. 12:994–1005. - PubMed
    1. Annabi, B., Y.-T. Lee, S. Turcotte, E. Naud, R.R. Desrosiers, M. Champagne, N. Eliopoulos, J. Galipeau, and R. Beliveau. 2003. Hypoxia promotes murine bone-marrow-derived stromal cell migration and tube formation. Stem Cells. 21:337–347. - PubMed
    1. Ball, S.G., A.C. Shuttleworth, and C.M. Kielty. 2004. Direct cell contact influences bone marrow mesenchymal stem cell fate. Int. J. Biochem. Cell Biol. 36:714–727. - PubMed
    1. Ball, S.G., A.C. Shuttleworth, and C.M. Kielty. 2007. Platelet-derived growth factor receptor-alpha is a key determinant of smooth muscle alpha-actin filaments in bone marrow-derived mesenchymal stem cells. Int. J. Biochem. Cell Biol. 39:379–391. - PubMed

Publication types

MeSH terms

Substances