. 2007 May 8;104(19):7809-14.
doi: 10.1073/pnas.0700373104. Epub 2007 Apr 30.

Class IA phosphoinositide 3-kinases are obligate p85-p110 heterodimers

Affiliations

Class IA phosphoinositide 3-kinases are obligate p85-p110 heterodimers

Barbara Geering et al. Proc Natl Acad Sci U S A. .

Abstract

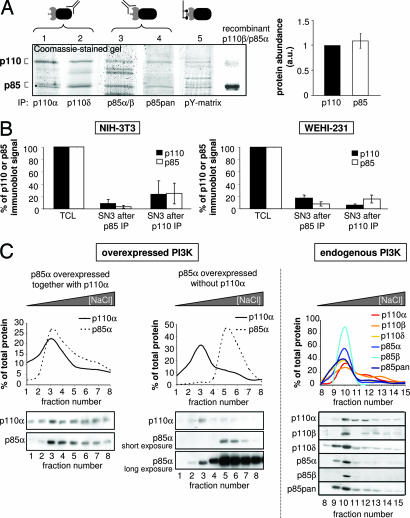
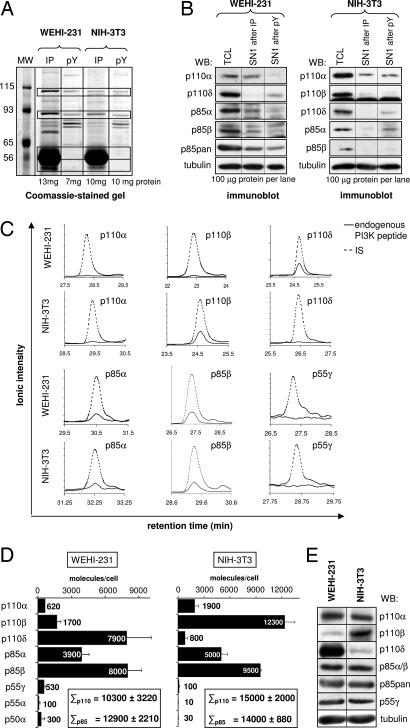
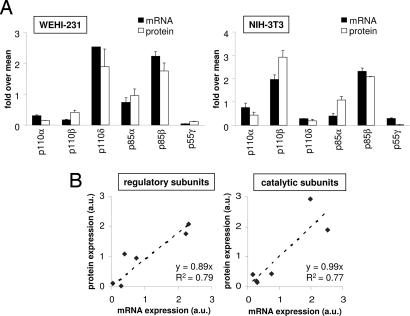
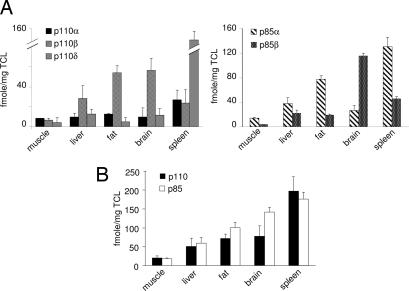
Class IA phosphoinositide 3-kinases (PI3Ks) signal downstream of tyrosine kinases and Ras and control a wide variety of biological responses. In mammals, these heterodimeric PI3Ks consist of a p110 catalytic subunit (p110alpha, p110beta, or p110delta) bound to any of five distinct regulatory subunits (p85alpha, p85beta, p55gamma, p55alpha, and p50alpha, collectively referred to as "p85s"). The relative expression levels of p85 and p110 have been invoked to explain key features of PI3K signaling. For example, free (i.e., non-p110-bound) p85alpha has been proposed to negatively regulate PI3K signaling by competition with p85/p110 for recruitment to phosphotyrosine docking sites. Using affinity and ion exchange chromatography and quantitative mass spectrometry, we demonstrate that the p85 and p110 subunits are present in equimolar amounts in mammalian cell lines and tissues. No evidence for free p85 or p110 subunits could be obtained. Cell lines contain 10,000-15,000 p85/p110 complexes per cell, with p110beta and p110delta being the most prevalent catalytic subunits in nonleukocytes and leukocytes, respectively. These results argue against a role of free p85 in PI3K signaling and provide insights into the nonredundant functions of the different class IA PI3K isoforms.


Conflict of interest statement

Conflict of interest statement: Bart Vanhaesebroeck is a consultant for PIramed (Slough, U.K.).

Figures

Fig. 1.
Fig. 1.
Analysis of the ratio of p85 to p110 PI3K subunits in PI3K complexes. (A) PI3K subunits were immunoprecipitated from WEHI-231 and NIH 3T3 cell lysates by using isoform-specific Abs to p110 or p85 or were isolated by affinity purification by using a pY matrix (made up of immobilized peptides containing a phosphorylated Tyr residue in a YxxM motif that binds p85s), resolved by SDS/PAGE, and detected by colloidal Coomassie blue staining. Recombinant p85α/p110β was loaded as a control for protein separation. (Left) Representative SDS/PAGE gel. (Right) Average of the optical densities at 110 kDa and 85 kDa from eight independent SDS/PAGE gels, similar to the one shown in A Left. (B) Analysis of the presence of p85 and p110 in NIH 3T3 and WEHI-231 cell extracts after three rounds of immunodepletion with Abs to p110 or p85. Sequential IPs, using a mixture of p110 or p85 Abs, were performed on TCL. Samples of preabsorbed TCL and of SN after three rounds of depletion (SN3) were resolved by SDS/PAGE, followed by detection of class IA PI3K proteins by immunoblotting (using Abs to p110α, p110β, p110δ, p85α, and p85β) and quantification of optical densities. The graph represents the averages from two independent experiments. (C) Elution profiles of p110 and p85 after anion exchange chromatography of TCL. Cell extracts of HEK-293T cells, transiently transfected with p85α in the presence (Left) or absence (Center) of overexpressed p110α, were resolved by anion exchange chromatography, followed by immunoblotting for p85α and p110α in the different elution fractions. Immunoblotting signals were quantified to generate elution profiles. (Right) Endogenous PI3K isoforms from WEHI-231 cells were analyzed by anion exchange chromatography and immunoblotting as described above. A representative experiment of two is shown.
Fig. 2.
Fig. 2.
Determination of the absolute amounts of class IA PI3K subunits in murine cell lines. (A) Class IA PI3Ks were isolated from the indicated cell lines by IP using a mix of p110 and p85 Abs or by absorption onto the pY matrix, followed by separation by SDS/PAGE and visualization by colloidal Coomassie blue staining. Horizontal boxes indicate the gel sections that were excised for the further analysis shown in C and D and in SI Fig. 7. The abundant, ≈56-kDa protein in lanes 2 and 4 is the heavy chain of the Ab used for IP. (B) Protein depletion was assessed by immunoblotting for class IA PI3K isoforms in TCL compared with SN1 after one round of IP or pY pull-down. (C) Representative extracted ion chromatograms of endogenous and IS (2-pmol) peptides of immunoprecipitated class IA PI3Ks. For each subunit, all endogenous and IS peptides listed in SI Table 1 were analyzed. (D) The number of class IA PI3K molecules per cell as determined by quantitative MS. The total of all catalytic and regulatory subunit protein amounts is shown. (E) Immunoblot analysis of class IA PI3K isoforms in 100-μg TCL of WEHI-231 and NIH 3T3 cells.
Fig. 3.
Fig. 3.
Relationship between protein and mRNA levels of PI3K isoforms in WEHI-231 and NIH 3T3 cell lines. (A) Class IA PI3K mRNA and protein amounts in WEHI-231 and NIH 3T3 cells. Each mRNA or protein value was standardized to the mean of all catalytic and regulatory subunits, respectively. (B) Relationship between mRNA and protein expression of class IA PI3K subunits. Each mRNA and protein value was standardized to the mean of all catalytic and regulatory subunits, respectively, independent of the cell line used. Graphs were constructed by using the pooled data shown in A.
Fig. 4.
Fig. 4.
Quantification of class IA PI3K isoforms in murine tissues. (A) Protein expression levels of class IA PI3K isoforms in mouse tissues. The value for each class IA PI3K isoform was determined by comparison of peak integrated areas of endogenous and IS peptides (data not shown). (B) Total amount of p110 and p85 subunits in different mouse tissues.

References

    1. Vanhaesebroeck B, Waterfield MD. Exp Cell Res. 1999;253:239–254. - PubMed
    1. Hawkins PT, Anderson KE, Davidson K, Stephens LR. Biochem Soc Trans. 2006;34:647–662. - PubMed
    1. Vanhaesebroeck B, Welham MJ, Kotani K, Stein R, Warne PH, Zvelebil MJ, Higashi K, Volinia S, Downward J, Waterfield MD. Proc Natl Acad Sci USA. 1997;94:4330–4335. - PMC - PubMed
    1. Dhand R, Hara K, Hiles I, Bax B, Gout I, Panayotou G, Fry MJ, Yonezawa K, Kasuga M, Waterfield MD. EMBO J. 1994;13:511–521. - PMC - PubMed
    1. Yu J, Zhang Y, McIlroy J, Rordorf-Nikolic T, Orr GA, Backer JM. Mol Cell Biol. 1998;18:1379–1387. - PMC - PubMed

Publication types

LinkOut - more resources