A high-resolution genetic signature of demographic and spatial expansion in epizootic rabies virus
- PMID: 17470818
- PMCID: PMC1876560
- DOI: 10.1073/pnas.0700741104
A high-resolution genetic signature of demographic and spatial expansion in epizootic rabies virus
Abstract
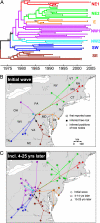
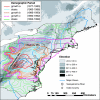
Emerging pathogens potentially undergo rapid evolution while expanding in population size and geographic range during the course of invasion, yet it is generally difficult to demonstrate how these processes interact. Our analysis of a 30-yr data set covering a large-scale rabies virus outbreak among North American raccoons reveals the long lasting effect of the initial infection wave in determining how viral populations are genetically structured in space. We further find that coalescent-based estimates derived from the genetic data yielded an amazingly accurate reconstruction of the known spatial and demographic dynamics of the virus over time. Our study demonstrates the combined evolutionary and population dynamic processes characterizing the spread of pathogen after its introduction into a fully susceptible host population. Furthermore, the results provide important insights regarding the spatial scale of rabies persistence and validate the use of coalescent approaches for uncovering even relatively complex population histories. Such approaches will be of increasing relevance for understanding the epidemiology of emerging zoonotic diseases in a landscape context.
Conflict of interest statement
The authors declare no conflict of interest.
Figures


References
Publication types
MeSH terms
Associated data
- Actions
- Actions
- Actions
- Actions
- Actions
- Actions
- Actions
- Actions
- Actions
- Actions
- Actions
- Actions
- Actions
- Actions
- Actions
- Actions
- Actions
- Actions
- Actions
- Actions
- Actions
- Actions
- Actions
- Actions
- Actions
- Actions
- Actions
- Actions
- Actions
- Actions
- Actions
- Actions
- Actions
- Actions
- Actions
- Actions
- Actions
- Actions
- Actions
- Actions
- Actions
- Actions
- Actions
- Actions
- Actions
- Actions
- Actions
- Actions
- Actions
- Actions
- Actions
- Actions
- Actions
- Actions
- Actions
- Actions
- Actions
- Actions
- Actions
- Actions
- Actions
- Actions
- Actions
- Actions
- Actions
- Actions
- Actions
- Actions
- Actions
- Actions
- Actions
- Actions
- Actions
- Actions
- Actions
- Actions
- Actions
- Actions
- Actions
- Actions
- Actions
- Actions
- Actions
- Actions
- Actions
- Actions
- Actions
- Actions
Grants and funding
LinkOut - more resources
Full Text Sources
Other Literature Sources
Medical

