

The phi complex as a neuromarker of human social coordination
- PMID: 17470821
- PMCID: PMC1859993
- DOI: 10.1073/pnas.0611453104
The phi complex as a neuromarker of human social coordination
Abstract
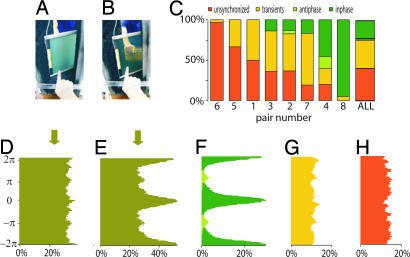
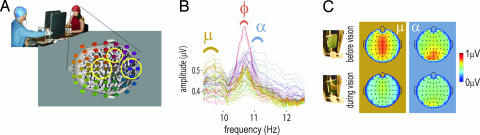
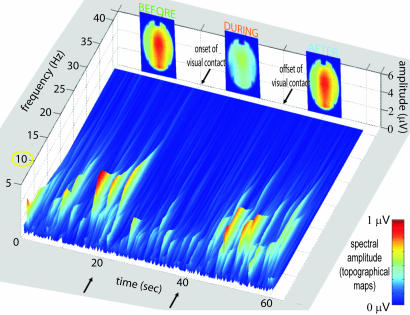
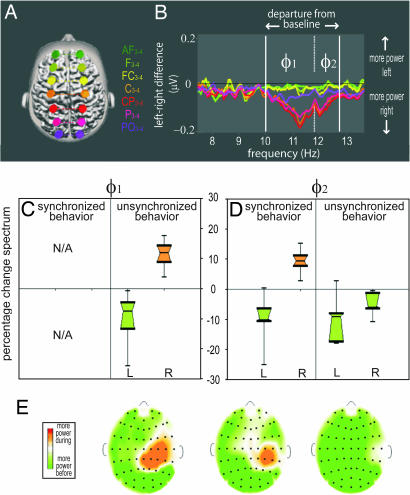
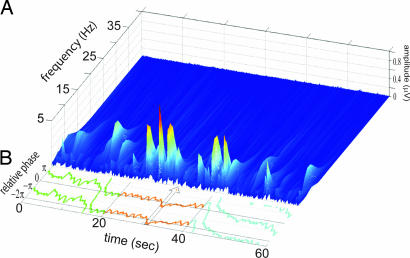
Many social interactions rely upon mutual information exchange: one member of a pair changes in response to the other while at the same time producing actions that alter the behavior of the other. However, little is known about how such social processes are integrated in the brain. Here, we used a specially designed dual-electroencephalogram system and the conceptual framework of coordination dynamics to identify neural signatures of effective, real-time coordination between people and its breakdown or absence. High-resolution spectral analysis of electrical brain activity before and during visually mediated social coordination revealed a marked depression in occipital alpha and rolandic mu rhythms during social interaction that was independent of whether behavior was coordinated or not. In contrast, a pair of oscillatory components (phi(1) and phi(2)) located above right centro-parietal cortex distinguished effective from ineffective coordination: increase of phi(1) favored independent behavior and increase of phi(2) favored coordinated behavior. The topography of the phi complex is consistent with neuroanatomical sources within the human mirror neuron system. A plausible mechanism is that the phi complex reflects the influence of the other on a person's ongoing behavior, with phi(1) expressing the inhibition of the human mirror neuron system and phi(2) its enhancement.
Conflict of interest statement
The authors declare no conflict of interest.
Figures
Similar articles
-
The coordination dynamics of social neuromarkers.Front Hum Neurosci. 2015 Oct 20;9:563. doi: 10.3389/fnhum.2015.00563. eCollection 2015. Front Hum Neurosci. 2015. PMID: 26557067 Free PMC article.
-
Social Coordination Information in Dynamic Chase Modulates EEG Mu Rhythm.Sci Rep. 2017 Jul 6;7(1):4782. doi: 10.1038/s41598-017-04129-2. Sci Rep. 2017. PMID: 28684759 Free PMC article.
-
Neural correlates underpinning synchronized movement of double scull rowers.Sci Rep. 2021 Feb 3;11(1):2981. doi: 10.1038/s41598-021-82392-0. Sci Rep. 2021. PMID: 33536538 Free PMC article.
-
Understanding social motor coordination.Hum Mov Sci. 2011 Oct;30(5):834-45. doi: 10.1016/j.humov.2010.05.014. Epub 2010 Sep 2. Hum Mov Sci. 2011. PMID: 20817320 Review.
-
Self-other relations in social development and autism: multiple roles for mirror neurons and other brain bases.Autism Res. 2008 Apr;1(2):73-90. doi: 10.1002/aur.15. Autism Res. 2008. PMID: 19360654 Review.
Cited by
-
A neurodynamic model of inter-brain coupling in the gamma band.J Neurophysiol. 2022 Nov 1;128(5):1085-1090. doi: 10.1152/jn.00224.2022. Epub 2022 Sep 7. J Neurophysiol. 2022. PMID: 36070245 Free PMC article.
-
Oscillatory Brain Correlates of Live Joint Attention: A Dual-EEG Study.Front Hum Neurosci. 2012 Jun 1;6:156. doi: 10.3389/fnhum.2012.00156. eCollection 2012. Front Hum Neurosci. 2012. PMID: 22675297 Free PMC article.
-
Difficulty leading interpersonal coordination: towards an embodied signature of social anxiety disorder.Front Behav Neurosci. 2014 Feb 6;8:29. doi: 10.3389/fnbeh.2014.00029. eCollection 2014. Front Behav Neurosci. 2014. PMID: 24567707 Free PMC article.
-
On the interpretation of synchronization in EEG hyperscanning studies: a cautionary note.Front Hum Neurosci. 2013 Dec 24;7:881. doi: 10.3389/fnhum.2013.00881. eCollection 2013. Front Hum Neurosci. 2013. PMID: 24399948 Free PMC article.
-
Virtual Partner Interaction (VPI): exploring novel behaviors via coordination dynamics.PLoS One. 2009 Jun 3;4(6):e5749. doi: 10.1371/journal.pone.0005749. PLoS One. 2009. PMID: 19492044 Free PMC article.
References
-
- Elsinger CL, Harrington DL, Rao SM. NeuroImage. 2006;31:1177–1187. - PubMed
-
- Boussaoud D. NeuroImage. 2001;14:S40–S45. - PubMed
-
- Lau HC, Rogers RD, Haggard P, Passingham RE. Science. 2004;303:1208–1210. - PubMed
-
- Rizzolatti G, Fadiga L, Gallese V, Fogassi L. Cognit Brain Res. 1996;3:131–141. - PubMed
-
- Rizzolatti G, Craighero L. Annu Rev Neurosci. 2004;27:169–192. - PubMed
Publication types
MeSH terms
Substances
Grants and funding
LinkOut - more resources
Full Text Sources
Other Literature Sources
Medical
Research Materials
