

Mapping of QTL associated with waterlogging tolerance during the seedling stage in maize
- PMID: 17470902
- PMCID: PMC3244372
- DOI: 10.1093/aob/mcm055
Mapping of QTL associated with waterlogging tolerance during the seedling stage in maize
Abstract
Background and aims: Soil waterlogging is a major environmental stress that suppresses maize (Zea mays) growth and yield. To identify quantitative trait loci (QTL) associated with waterlogging tolerance at the maize seedling stage, a F2 population consisting of 288 F(2:3) lines was created from a cross between two maize genotypes, 'HZ32' (waterlogging-tolerant) and 'K12' (waterlogging-sensitive).
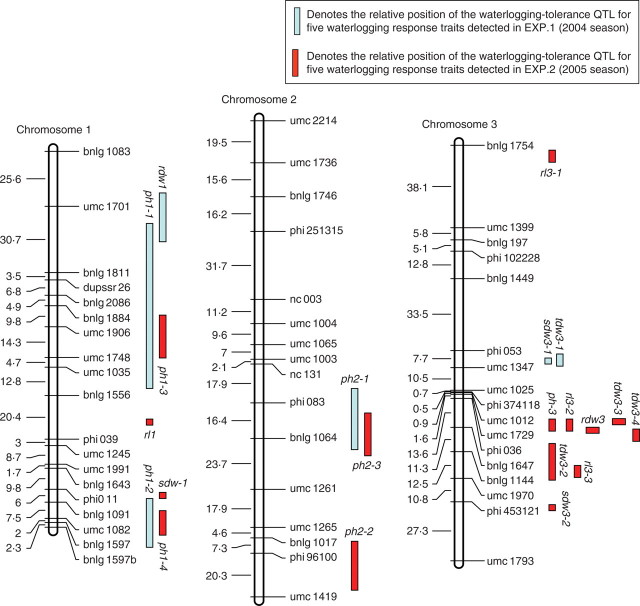
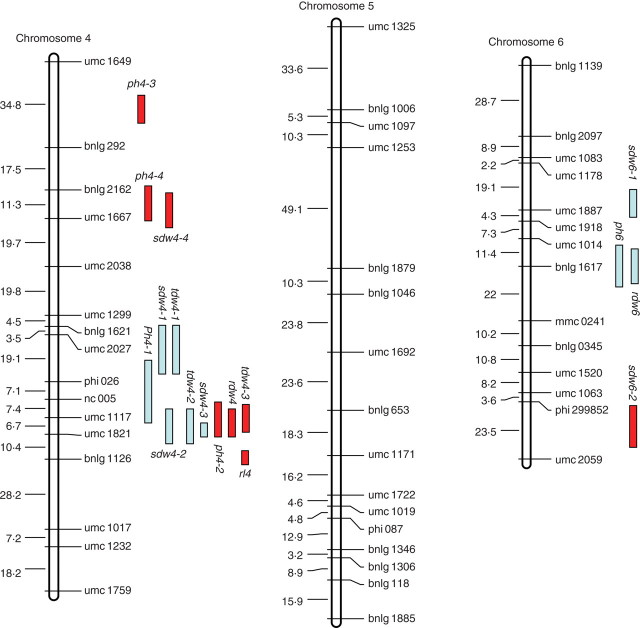
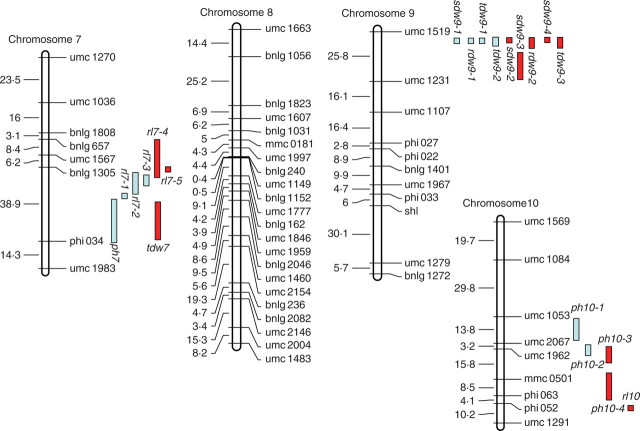
Methods: The F2 population was genotyped and a base-map of 1710.5 cM length was constructed with an average marker space of 11.5 cM based on 177 SSR (simple sequence repeat) markers. QTL associated with root length, root dry weight, plant height, shoot dry weight, total dry weight and waterlogging tolerance coefficient were identified via composite interval mapping (CIM) under waterlogging and control conditions in 2004 (EXP.1) and 2005 (EXP.2), respectively.
Key results and conclusions: Twenty-five and thirty-four QTL were detected in EXP.1 and EXP.2, respectively. The effects of each QTL were moderate, ranging from 3.9 to 37.3 %. Several major QTL determining shoot dry weight, root dry weight, total dry weight, plant height and their waterlogging tolerance coefficient each mapped on chromosomes 4 and 9. These QTL were detected consistently in both experiments. Secondary QTL influencing tolerance were also identified and located on chromosomes 1, 2, 3, 6, 7 and 10. These QTL were specific to particular traits or environments. Although the detected regions need to be mapped more precisely, the findings and QTL found in this study may provide useful information for marker-assisted selection (MAS) and further genetic studies on maize waterlogging tolerance.
Figures
References
-
- Ali ML, Pathan MS, Zhang J, Bai G, Sarkarung S, Nguyen HT. Mapping QTLs for root traits in a recombinant inbred population from two indica ecotypes in rice. Theoretical and Applied Genetics. 2000;101:756–766.
-
- Allard RW. Future direction in plant population genetics, evolution and breeding. In: Brown AHD, Clegg MT, Kahler AL, Weir BS,, editors. Plant population genetics and germplasm resources. Sunderland, MA: Sinauer Associates Inc; 1988. pp. 1–19.
-
- Anonymous. Studies on physio-genetic mechanism of excess soil moisture tolerance in maize. 2003 National Agricultural Technology Project, Department of Agricultural Research and Education: Indian Council of Agricultural Research (India) Wisard Project Information.
-
- Armstrong W. Aeration in higher plants. In: Woolhouse HW, editor. Advances in botanical research. Vol. 7. New York: Academic Press; 1979. pp. 225–232.
-
- Armstrong W, Drew MC. Root growth and metabolism under oxygen deficiency. In: Waisel Y, Eshel A, Kafkafi U,, editors. Plant roots: the hidden half. 3rd edn. New York: Marcel Dekker; 2002. pp. 729–761.
Publication types
MeSH terms
Substances
LinkOut - more resources
Full Text Sources
Miscellaneous
