. 2007 May;134(10):1943-54.
doi: 10.1242/dev.002519.

Mitotic spindle orientation distinguishes stem cell and terminal modes of neuron production in the early spinal cord

Affiliations

Mitotic spindle orientation distinguishes stem cell and terminal modes of neuron production in the early spinal cord

Arwen C Wilcock et al. Development. 2007 May.

Abstract

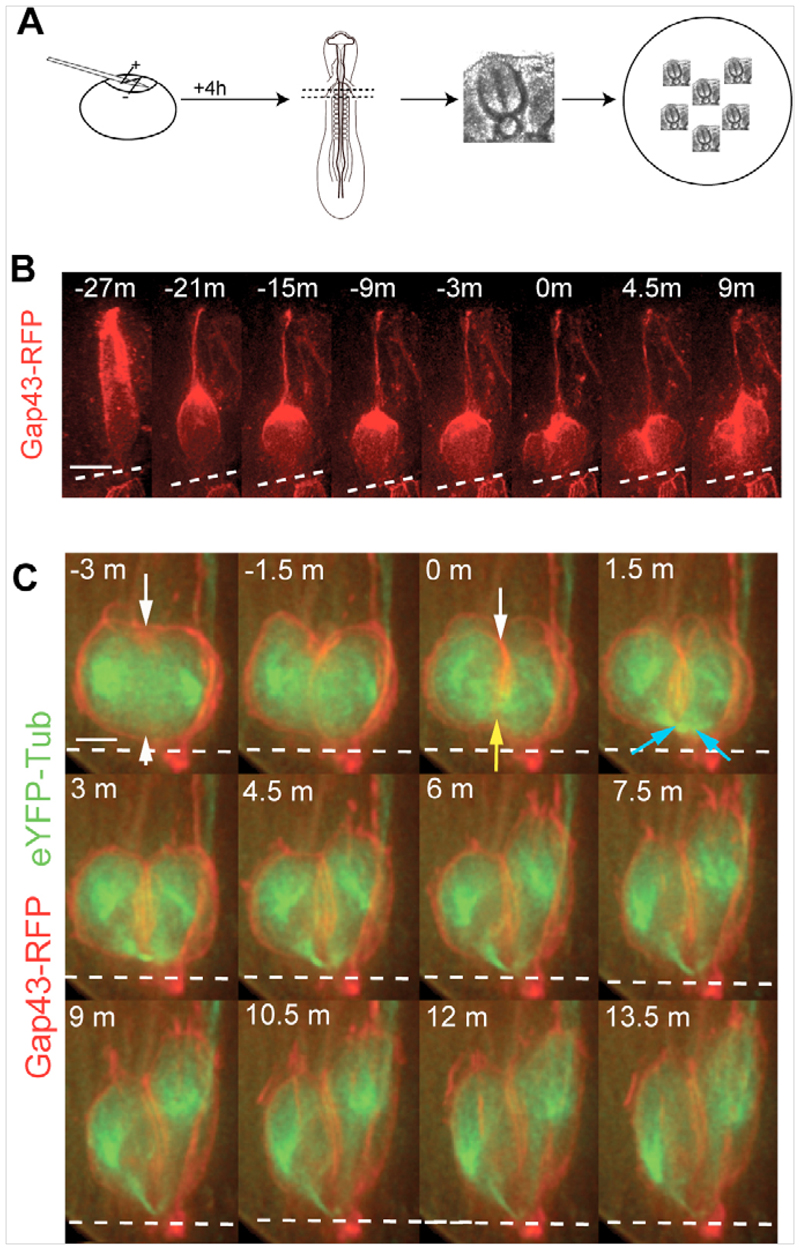
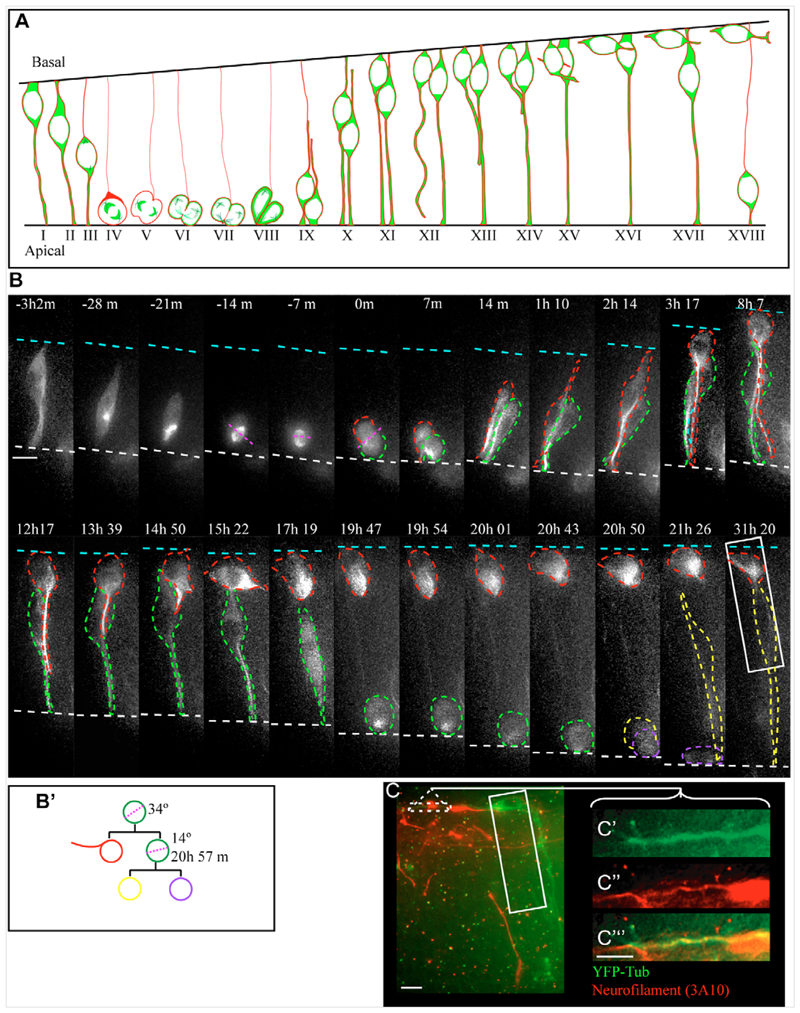
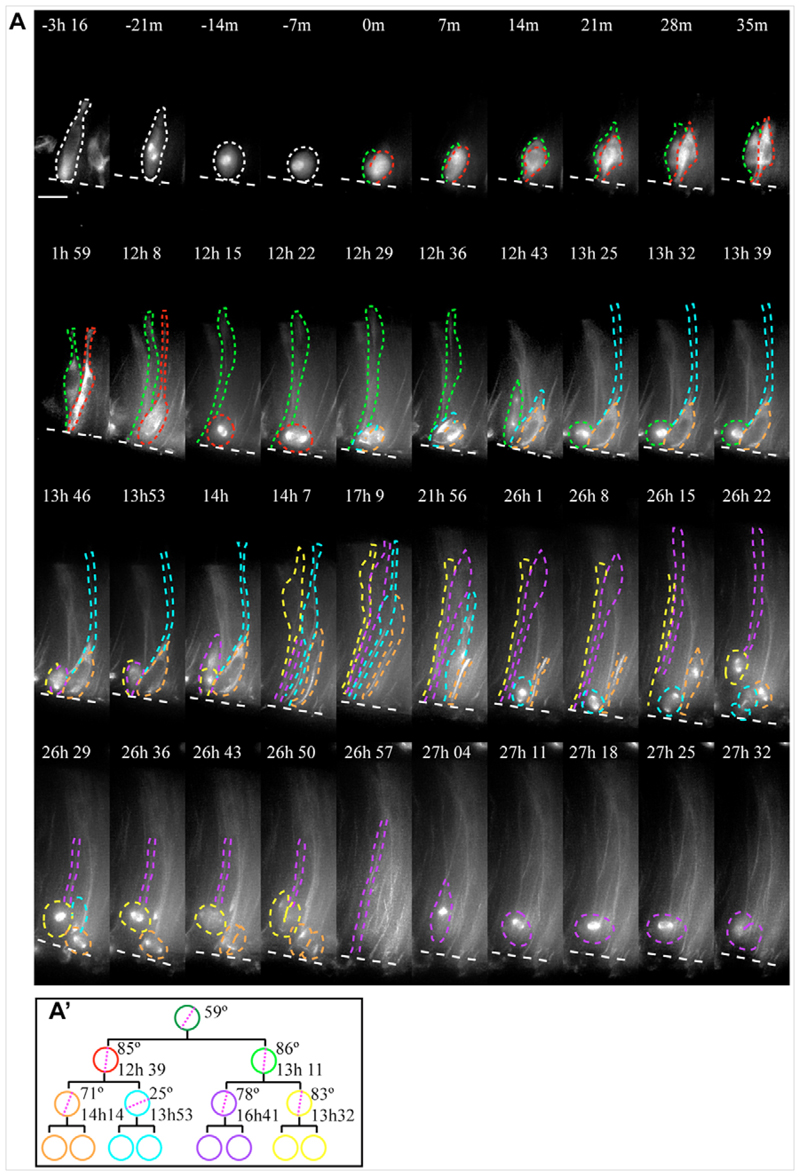
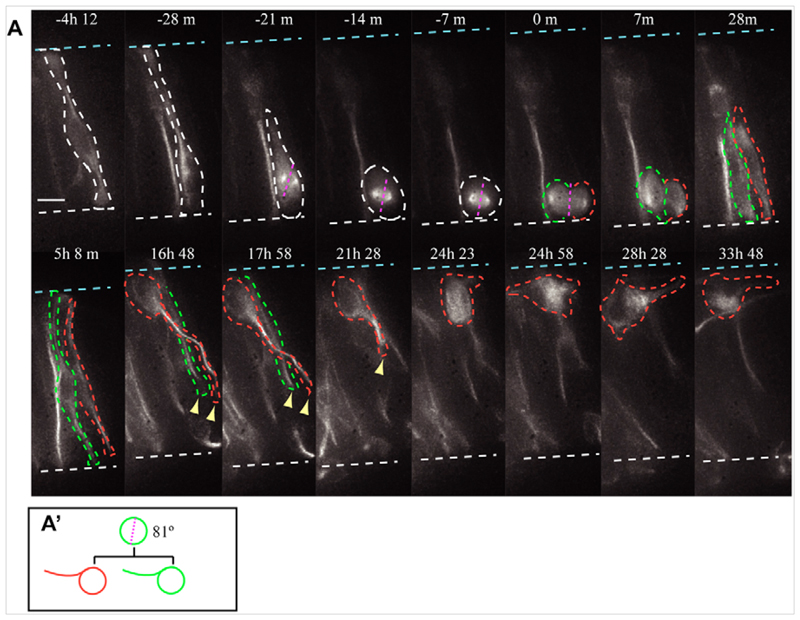
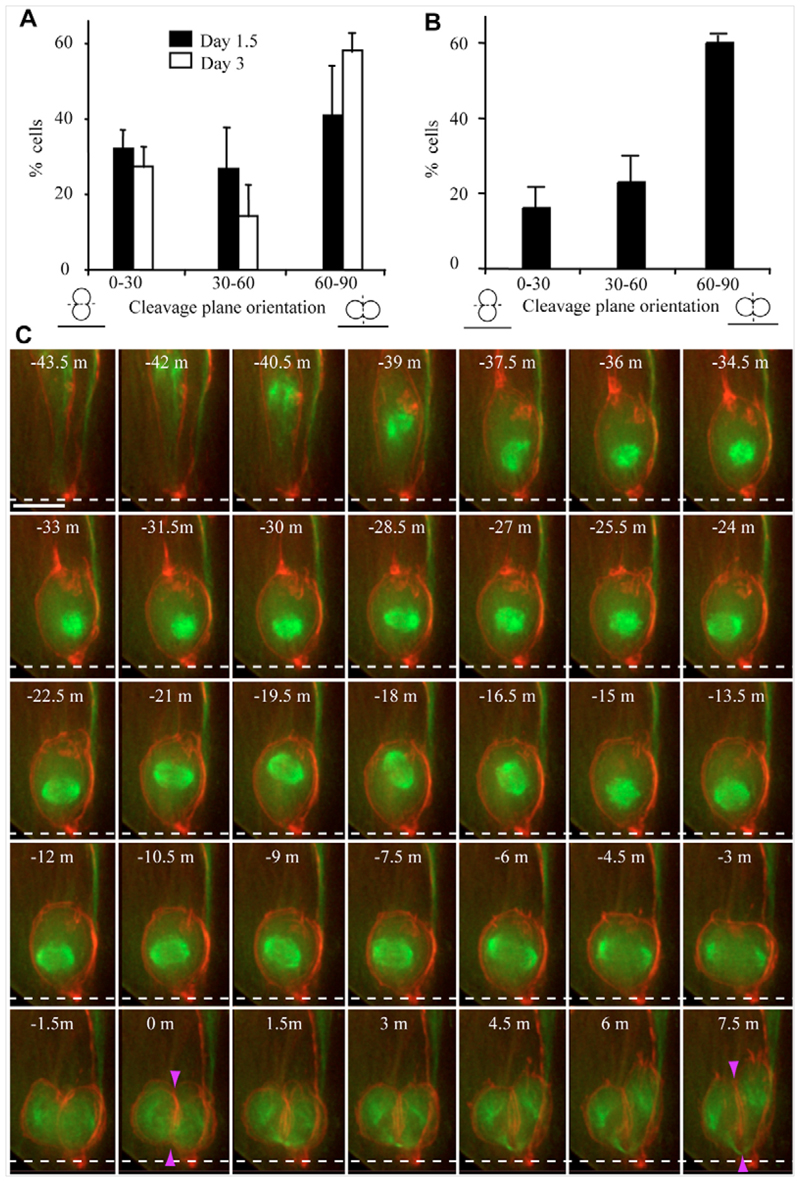
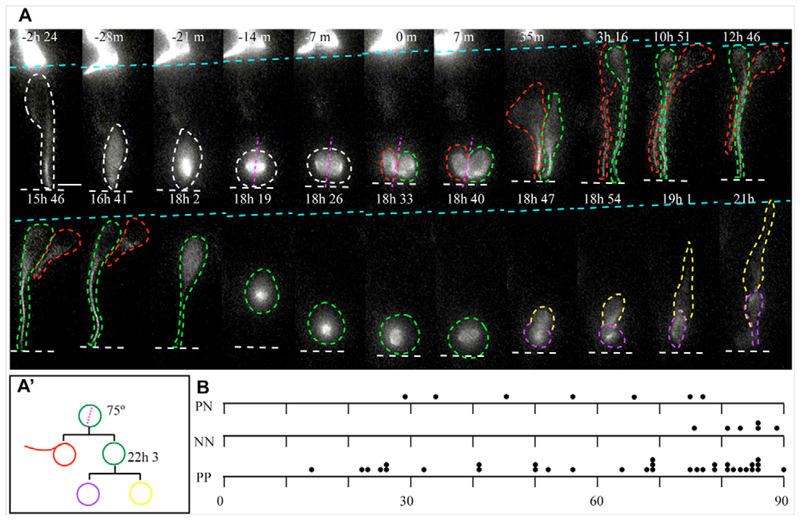
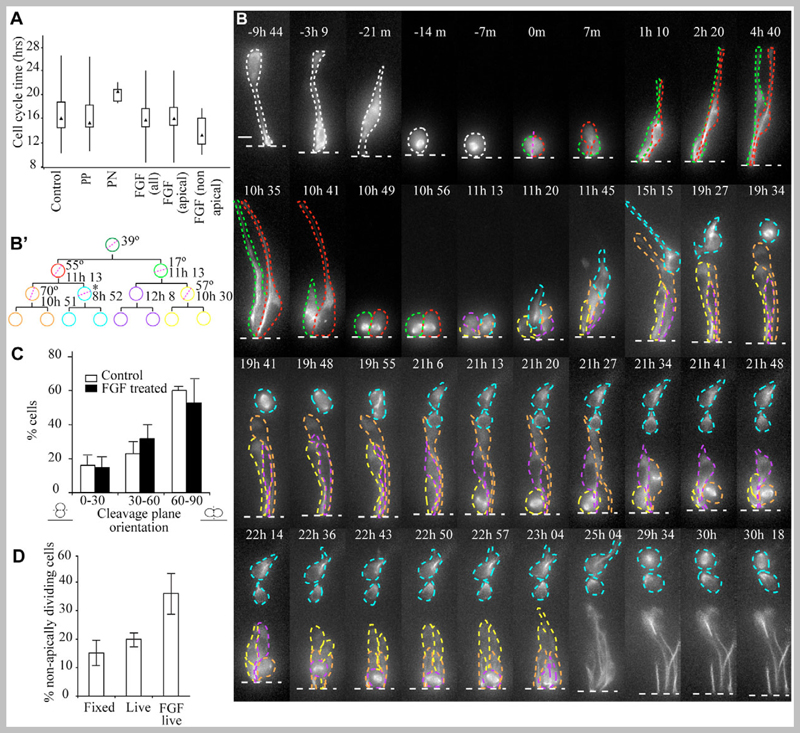
Despite great insight into the molecular mechanisms that specify neuronal cell type in the spinal cord, cell behaviour underlying neuron production in this tissue is largely unknown. In other neuroepithelia, divisions with a perpendicular cleavage plane at the apical surface generate symmetrical cell fates, whereas a parallel cleavage plane generates asymmetric daughters, a neuron and a progenitor in a stem cell mode, and has been linked to the acquisition of neuron-generating ability. Using a novel long-term imaging assay, we have monitored single cells in chick spinal cord as they transit mitosis and daughter cells become neurons or divide again. We reveal new morphologies accompanying neuron birth and show that neurons are generated concurrently by asymmetric and terminal symmetric divisions. Strikingly, divisions that generate two progenitors or a progenitor and a neuron both exhibit a wide range of cleavage plane orientations and only divisions that produce two neurons have an exclusively perpendicular orientation. Neuron-generating progenitors are also distinguished by lengthening cell cycle times, a finding supported by cell cycle acceleration on exposure to fibroblast growth factor (FGF), an inhibitor of neuronal differentiation. This study provides a novel, dynamic view of spinal cord neurogenesis and supports a model in which cleavage plane orientation/mitotic spindle position does not assign neuron-generating ability, but functions subsequent to this step to distinguish stem cell and terminal modes of neuron production.


Figures

Fig. 1
Fig. 1. Cell behaviour during mitosis in the early neural tube.
(A) Slice culture method; DNA is electroporated into the neural tube, embryo slices mounted on coverslip-based dishes and imaged on a Deltavision widefield microscope. (B) Cell membrane label (Gap43-mRFP1) reveals basal process retention during mitosis. Maximum intensity projections (MIP) of 15 z-sections, captured at 2.5 μm intervals. White broken line indicates the apical surface; scale bar: 10 μm. (C) Gap43-mRFP1 (red) visualizes initiation and progression of the cleavage furrow around the centre of the dividing cell (white arrows), whereas eYFP-α-tubulin (green) reveals the mitotic spindle, formation of the midbody by the central mitotic spindle (yellow arrow) and the contribution of this structure to two new apical processes on completion of cytokinesis (blue arrows). Images are MIP of 15 z-sections of each wavelength captured at 2.5 μm at 1.5-minute intervals. (See Movie 1 in the supplementary material.) Scale bar in C, 10 μm.
Fig. 2
Fig. 2. Neuron birth and asymmetric neuron production.
(A) Schematic of neuron birth: green, α-tubulin; red, cell membrane. I-III, migration of nuclei to apical surface ~3 hours; IV-VII, mitosis ~30 minutes; VIII-XI, apical-basal nuclei migration ~up to 9 hours post-mitosis; XII-XVI, release and retraction of the apical process, up to 15 hours and 25 hours post-mitosis, respectively; XVI-XVIII, cell body reorientation, production of an axon and return of sibling cell nucleus to apical surface for further division (times for five cells). (B) Asymmetric neuron production: a cell divides to produce a neuron (red dashed outline) and a progenitor cell (green dashed outline). Pink broken line indicates the cleavage plane. White broken line indicates apical surface. Blue broken line indicates basal surface. White box in final frame indicates region for comparison in C. Scale bar: 10 μm. Each image is a MIP through 30 z-sections imaged at 1.5 μm intervals. (B′) Lineage tree for cells in B. (See Movie 2 in the supplementary material.) (C) Immunocytochemistry to confirm neuronal identity of the cell in B marked by a red dashed outline. Axonal process from eYFP-positive cell (green) in final stills frame (white box in B, and see Movie 2 in the supplementary material) labelled with 3A10 (red, a monoclonal antibody that recognizes a neurofilament-associated protein). MIP through 30 z-sections imaged at 1.5 μm intervals. Scale bar: 10 μm. (C′-C‴) Region framed by dashed box in C. (C′) eYFP; (C″) 3A10 labelling; (C‴) eYFP/R merge. MIP through 3 μm of the field in view; scale bar: 5 μm.
Fig. 3
Fig. 3. Progenitor-generating divisions.
(A) A progenitor-generating lineage. The nucleus of the mother cell (white dashed outline) migrates apically (white broken line) and divides to produce two daughter progenitors (red and green dashed outlines). These cells divide again, producing four progenitor cells (yellow, orange, blue and purple dashed outlines) that each divide once more. MIP through 30 z-sections imaged at 1.5 μm intervals; scale bar: 10 μm. (A′) Lineage tree for A. (See Movie 3 in the supplementary material.)
Fig. 4
Fig. 4. Symmetric neuron production.
(A) A terminal division producing two neurons. The nucleus of a cell (white dashed outline) migrates apically (white broken line) and divides. The cleavage plane (pink broken line) is perpendicular to the apical surface. Following mitosis the two daughter cells (red and green dashed outlines) maintain apical attachment and their nuclei migrate back towards the basal surface (blue broken line). Once the nuclei are at the basal surface both apical processes withdraw. The nucleus of the cell outlined in green becomes obscured, but three-dimensional analysis confirms that it also continues to withdraw its apical process (yellow arrowhead). Scale bar: 10 μm. Each image is a MIP through 30 z-sections imaged at 1.5 μm intervals. (A′) Lineage tree for A. (See Movie 4 in the supplementary material.)
Fig. 5
Fig. 5. Cleavage plane orientations in fixed and live tissue.
(A) Orientation of the cleavage plane in anaphase/telophase cells measured in DAPI-stained fixed 1.5-and 3-day-old embryos. Day 1.5 embryos (n=4 embryos), 198 divisions; day 3 embryos (n=3 embryos), 186 divisions. Error bars represent s.d. (B) Orientation of cleavage plane scored at cytokinesis in tissue slices taken at 1.5 days and cultured for up to 38 hours. Errors bars represent s.d.: 84 divisions, 12 slices, three experiments. An analysis of variance (ANOVA) test comparing cleavage plane orientation of cells in fixed tissue (data from A, pooling 1.5-and 3-day-old embryos) with cells in live tissue (data from B) shows no difference in the distribution of cleavage plane orientations in fixed and live tissue (P=0.2). (C) Mitotic spindle movements, cytokinesis and final cleavage plane orientation monitored at 1.5-minute intervals in cells labelled with Gap43-mRFP1 (red) and eYFP-tubulin (green). Cleavage plane orientation is maintained for at least 7.5 minutes post-cytokinesis (purple arrows); mean change in cleavage plane was 3.6×2.7° (n=20 cells). Broken line indicates the apical surface; scale bar: 10 μm. (See Movie 1 in the supplementary material.)
Fig. 6
Fig. 6. A perpendicular cleavage plane division giving asymmetric fates.
(A) A cell (white dashed outline) divides with a perpendicular cleavage plane (pink broken line) to generate a neuron (red outline) and a progenitor (green outline). Apical processes of both daughter cells are visible as their nuclei migrate back to the basal surface (blue broken line). The nucleus of one cell (red outline) reaches the basal surface first and starts to withdraw its apical process, whereas its sibling (green outline) continues back to the apical surface and divides again; the differentiating daughter cell (red outline) is photobleached in the last frames. Scale bar: 10 μm. Each image is a MIP through 30 z-sections taken at 1.5 μm intervals. (A′) Lineage tree for A. (See Movie 5 in the supplementary material.) (B) Dot plot showing cleavage plane orientations of all cells, the progeny of which could be followed to subsequent division or terminal differentiation.
Fig. 7
Fig. 7. Neurogenic divisions have a longer cell cycle and FGF accelerates cell cycle.
(A) Cell cycle times for divisions in control (untreated) and FGF-exposed slices. Box plot showing quartile ranges for cell cycle times of all control cells (PP+PN divisions, n=54); PP divisions (n=49); PN divisions (n=5); following exposure to FGF, all divisions (n=65); apically localized divisions (n=57); non-apical divisions (n=8). Statistical comparison was performed using the non-parametric two-tailed Mann-Whitney U-Wilcoxon rank sum test for pairwise comparison, as our data sets are not normally distributed; a P-value of <0.05 provides evidence that there is a 95% chance of a difference between compared data. PP compared with PN divisions, P=0.013; apical FGF compared with PP divisions, P=0.632; apical FGF compared with PN divisions, P=0.01; non-apical FGF compared with PP, P=0.048; with PN, P=0.002; and with apical FGF divisions, P=0.048). (B) Exposure to FGF produces only progenitor-generating divisions. A single cell located basally for ~10 hours in the presence of FGF divides apically to produce two daughter cells (red and green dashed outlines), which exhibit attenuated interkinetic nuclear migration. Some nuclei also divide non-apically (blue dashed outline). MIP of 30 images captured at 1.5 μm intervals. Scale bar: 10 μm. (B′) Lineage tree for cells represented in B. (See Movie 6 in the supplementary material.) (C) Comparison of cleavage plane orientation of divisions in control and FGF-treated slices, measured live from 1.5 days up to 38 hours. Error bars indicate s.d. (control: 84 divisions, 12 slices, three experiments; FGF-treated: 86 divisions, seven slices, three experiments.) FGF treatment does not result in a significant change in cleavage plane orientation. One-way ANOVA comparison of cleavage plane orientation of cells in live control and FGF-treated tissue (P=0.57), alpha level set at 0.05. (D) Proportion of cells dividing non-apically (>10 μm away from the apical surface) increases when tissue is treated with FGF. In fixed tissue 15±6% of mitotic cells are found away from the apical surface (505 cells, in 12 sections from six embryos); in live control tissue, 20±4% of divisions are non-apical (687 cells in 28 slices from 11 experiments). In FGF-treated tissue the proportion of non-apical divisions increases to 36±9% (300 cells, in 10 slices from six experiments). An ANOVA test between live control and live FGF-treated tissue provides evidence that there is a 95% chance of a statistical difference between these two populations (P=0.00004). Error bars indicate s.d.

References

    1. Afonso C, Henrique D. PAR3 acts as a molecular organizer to define the apical domain of chick neuroepithelial cells. J Cell Sci. 2006;119:4293–4304. - PubMed
    1. Bertrand N, Castro DS, Guillemot F. Proneural genes and the specification of neural cell types. Nat Rev Neurosci. 2002;3:517–530. - PubMed
    1. Betschinger J, Knoblich JA. Dare to be different: asymmetric cell division in Drosophila, C. elegans and vertebrates. Curr Biol. 2004;14:R674–R685. - PubMed
    1. Cai L, Hayes NL, Takahashi T, Caviness VS, Jr, Nowakowski RS. Size distribution of retrovirally marked lineages matches prediction from population measurements of cell cycle behavior. J Neurosci Res. 2002;69:731–744. - PubMed
    1. Calegari F, Huttner WB. An inhibition of cyclin-dependent kinases that lengthens, but does not arrest, neuroepithelial cell cycle induces premature neurogenesis. J Cell Sci. 2003;116:4947–4955. - PubMed

Publication types

Substances