

doi: 10.1038/sj.embor.7400970.
How many scientific papers should be retracted?
- PMID: 17471252
- PMCID: PMC1866214
- DOI: 10.1038/sj.embor.7400970
Item in Clipboard
How many scientific papers should be retracted?
EMBO Rep.
2007 May.
No abstract available
Figures
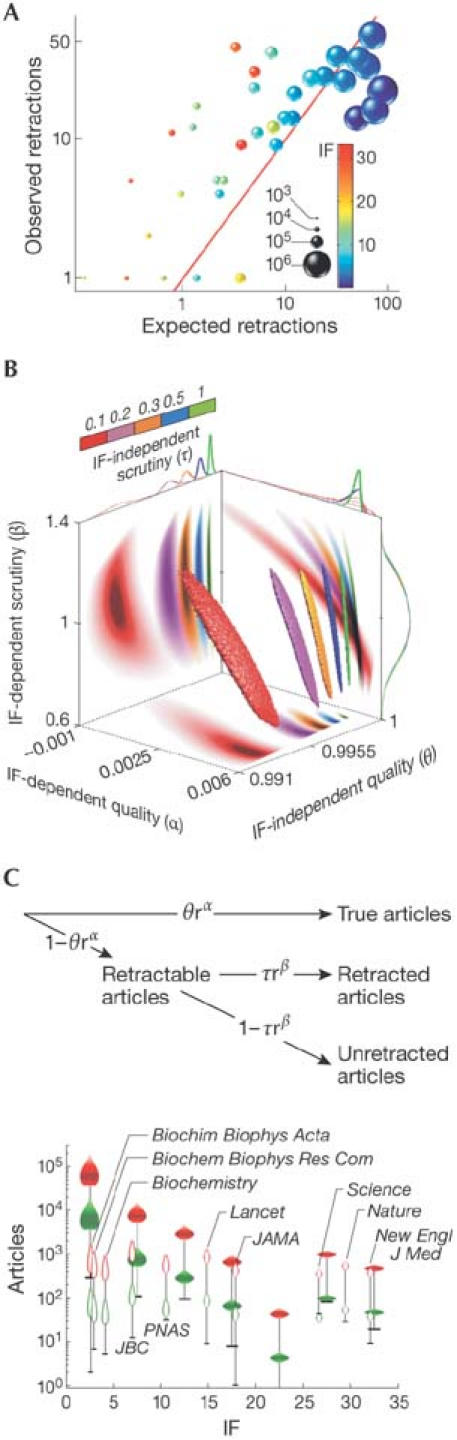
Dataset, model and estimation of the number of flawed articles in scientific literature. (A) Higher- and lower-impact factor (IF) journals have significantly more than expected and less than expected retracted articles, respectively. Each sphere represents the set of articles within the same IF range; the volume of the sphere is proportional to the set size and its colour represents the middle-of-the-bin IF value. The expected number of retractions is calculated under the assumption that all retractions are uniformly distributed among articles and journals. The red line indicates a hypothetical ideal correlation between the observed and the expected numbers of retractions. (B) and (C) explain the four-parameter graphical model describing our hypothetical stochastic publication–retraction process. (B) Estimated posterior distribution of parameter values for several values of impact-independent scrutiny. (C) Outline of the stochastic graphical model (top) and the posterior mean estimates of the number of articles that should be retracted (with 95% credible interval) plotted against different values of IF. Posterior distributions of estimated number of retractable articles: red- and green-coloured distributions correspond to τ = 0.1 and τ = 1, respectively; horizontal black solid lines indicate the actual number of retracted articles for individual IF bins and journals. The contour distributions represent individual journals, whereas the solid distributions correspond to the whole PubMed corpus binned by the IF value.
Comment in
-
Comment on the correspondence by Cokol et al.EMBO Rep. 2007 Sep;8(9):792-3; author reply 793. doi: 10.1038/sj.embor.7401053. EMBO Rep. 2007. PMID: 17767183 Free PMC article. No abstract available.
References
-
- Budd JM, Sievert M, Schultz TR (1998) Phenomena of retraction: reasons for retraction and citations to the publications. JAMA 280: 296–297 - PubMed
-
- Martinson BC, Anderson MS, de Vries R (2005) Scientists behaving badly. Nature 435: 737–738 - PubMed
-
- Stewart WW, Feder N (1987) The integrity of the scientific literature. Nature 325: 207–214 - PubMed
-
- Wohn DY, Normile D (2006) Korean cloning scandal. Science 312: 980–981 - PubMed
Publication types
MeSH terms
LinkOut - more resources
Full Text Sources
