. 2007 Aug;19(8):1754-64.
doi: 10.1016/j.cellsig.2007.03.011. Epub 2007 Apr 6.

Pulmonary endothelial cell barrier enhancement by FTY720 does not require the S1P1 receptor

Affiliations

Pulmonary endothelial cell barrier enhancement by FTY720 does not require the S1P1 receptor

S M Dudek et al. Cell Signal. 2007 Aug.

Abstract

Novel therapeutic strategies are needed to reverse the loss of endothelial cell (EC) barrier integrity that occurs during inflammatory disease states such as acute lung injury. We previously demonstrated potent EC barrier augmentation in vivo and in vitro by the platelet-derived phospholipid, sphingosine 1-phosphate (S1P) via ligation of the S1P1 receptor. The S1P analogue, FTY720, similarly exerts barrier-protective vascular effects via presumed S1P1 receptor ligation. We examined the role of the S1P1 receptor in sphingolipid-mediated human lung EC barrier enhancement. Both S1P and FTY-induced sustained, dose-dependent barrier enhancement, reflected by increases in transendothelial electrical resistance (TER), which was abolished by pertussis toxin indicating Gi-coupled receptor activation. FTY-mediated increases in TER exhibited significantly delayed onset and intensity relative to the S1P response. Reduction of S1P1R expression (via siRNA) attenuated S1P-induced TER elevations whereas the TER response to FTY was unaffected. Both S1P and FTY rapidly (within 5 min) induced S1P1R accumulation in membrane lipid rafts, but only S1P stimulated S1P1R phosphorylation on threonine residues. Inhibition of PI3 kinase activity attenuated S1P-mediated TER increases but failed to alter FTY-induced TER elevation. Finally, S1P, but not FTY, induced significant myosin light chain phosphorylation and dramatic actin cytoskeletal rearrangement whereas reduced expression of the cytoskeletal effectors, Rac1 and cortactin (via siRNA), attenuated S1P-, but not FTY-induced TER elevations. These results mechanistically characterize pulmonary vascular barrier regulation by FTY720, suggesting a novel barrier-enhancing pathway for modulating vascular permeability.


Figures

Figure 1
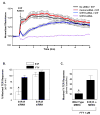
Figure 1. FTY720 enhances pulmonary EC barrier function in a dose-dependent but delayed manner relative to S1P
A) Concentration-dependent EC barrier enhancement by FTY. Human pulmonary artery endothelial cells (HPAEC) were plated in monolayer on gold microelectrodes and grown to confluence to measure transendothelial electrical resistance (TER) as described in Methods. The bar graph depicts TER data (+/− S.E.M.) as maximal % TER elevation induced with 60 min by FTY at concentrations from 0.01–10 μM vs. untreated controls. n=6–10 independent experiments per condition. B) Differential rate of barrier enhancement by various sphingolipids. Representative TER tracings for EC barrier enhancement at equivalent concentrations (1 μM) of S1P (—), FTY (---), or FTY-P (···) are shown. The gray line represents vehicle-stimulated control EC. Experiments were independently performed at least 5 times.
Figure 2
Figure 2. FTY-induced barrier enhancement is not dependent on S1P1R
A) HPAEC plated on gold microelectrodes were transfected with S1P1R siRNA, scrambled control siRNA, or mock control transfection (as described in Methods) and then stimulated with S1P (1 μM) at time=0 (arrow). The TER tracing represents pooled data (+ S.E.M.) from 4 independent experiments. B) The bar graph depicts pooled TER data from HPAEC transfected with S1P1R siRNA or S1P3R siRNA and then stimulated with 1 μM S1P (white bars) or 1 μM FTY (black bars). The data are expressed as percent maximal barrier enhancement (+/− S.E.M.) obtained within 60 min in scramble control siRNA transfected EC. n=3–5 independent experiments per condition. *p<0.01 vs. all other conditions. C) Wild type or S1P1R −/− mouse embryonic EC were plated on gold microelectrodes as per Methods and then stimulated with FTY 1 μM. The data represent maximal increased TER (+/− S.E.M.) above baseline observed following stimulation (n=4 per condition). *p=0.01.
Figure 3
Figure 3. FTY does not stimulate intracellular calcium release
Cultured HPAEC intracellular calcium concentrations were measured as described in Methods following stimulation with vehicle (A), S1P 1 μM (B), FTY 1 μM (C), or FTY-P 1 μM (D). Rapid but transient increase was detected following S1P but not the other conditions. E) The bar graph depicts pooled maximal intracellular calcium detected following stimulation (n=3 per condition). *p<0.05 vs. all other conditions.
Figure 4
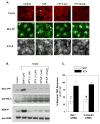
Figure 4. FTY-induced barrier enhancement does not involve dramatic cytoskeletal rearrangement as seen with S1P
A) Confluent HPAEC were stimulated with S1P 1μM for 5 min or FTY 1μM for 5 or 30 min. Cells were then fixed using formaldehyde and stained with phalloidin for F-actin (red), diphosphorylated myosin light chain (MLC-pp) antibody (green), or S1P1R antibody (gray scale). Arrows indicate increased cortical actin, increased peripheral ppMLC, and loss of peripheral S1P1R in S1P-stimulated EC. B) Confluent HPAEC were stimulated with S1P, FTY, or FTY-P (concentrations as above) for 0–5 min and then lysed for Western blotting. Note that all wells represent equal loading of total proteins. Experiments were performed in triplicate with reproducible findings (representative data shown). C) The bar graph depicts pooled TER data from HPAEC transfected with Rac1 siRNA or cortactin siRNA and then stimulated with 1 μM S1P (white bars) or FTY (black bars). The data are expressed as percent maximal barrier enhancement at 60 min relative to control siRNA transfected EC. n=6–8 independent experiments per condition. *p<0.005 vs. FTY-stimulated Rac1 siRNA-treated EC. #p<0.001 vs. FTY-stimulated cortactin siRNA-treated EC. Note that FTY-stimulated Rac1 or cortactin siRNA-treated EC are not statistically different from FTY-stimulated control siRNA transfected EC.
Figure 5
Figure 5. Phosphorylation status of FTY in EC
Adenoviral overexpression of HPAEC (MOI=10) with vector, sphingosine kinase 1 (SphK1), or sphingosine kinase 2 (SphK2) was performed as per Methods. EC were then labeled with 32P for several hours before incubation with precursors sphingosine (Sph) or FTY for 15 min. Lipid extraction was performed and then subjected to 2-phase thin layer chromatography. Radiolabeled exogenous S1P was run in the first lane as a marker control. In vector infected EC, Sph is phosphorylated to S1P, but no FTY-P is detected after FTY addition. However, in both SphK1 and SphK2 overexpressing EC, FTY conversion to FTY-P is seen (black arrows).
Figure 6
Figure 6. FTY-induced barrier enhancement is Gi-coupled and requires signaling through membrane lipid rafts but does not phosphorylate S1P1R
A) Confluent HPAEC were stimulated with 1 μM S1P (white bars) or FTY (black bars) 48 hrs after infection with wild type SphK1 adenovirus (MOI=10), or after a 2 hour preincubation with 100 ng/ml Pertussis toxin (PTX), 30 min preincubation with 200 μM Genistein, one hr preincubations with 10 mM methyl-β-cyclodextrin (MβCD), LY294002 (10 μM), or KRN633 (100 nM). The data are expressed as percent maximal barrier enhancement at 60 min relative to control viral-infected or vehicle-treated EC. n=3–10 independent experiments per condition. *p<0.001 vs. S1P or FTY-stimulated, control EC. #p<0.05 vs. S1P or FTY-stimulated, control EC. B) Confluent HPAEC were stimulated with either vehicle (control), 1 μM S1P (5 min), or 1 μM FTY (5 or 30 min) and then solubilized in 4°C Triton X-100 and treated with Optiprep as described in Methods to isolate lipid rafts. Immunoblot anaylsis of the 20% Optiprep lipid raft- containing fractions was performed using anti-S1P1R, anti-S1P3R, anti-AKT-P, and anti- Pan-AKT antibodies. Experiments were performed in triplicate each with similar results. Representative data are shown. C) Confluent HPAEC were stimulated with either vehicle (control), 1 μM S1P (5 min), or 1 μM FTY (5 or 30 min). S1P1R was then immunoprecipitated from the EC lysates (as described in Methods) and probed with phosphothreonine antibody to determine phosphorylation status of the receptor. Experiments were performed in triplicate each with similar results. Representative data are shown.
Figure 7
Figure 7. The Cannabinoid receptors do not mediate FTY-induced EC barrier enhancement
HPAEC were plated on gold microelectrodes as per Methods and then stimulated with FTY (1 μM) plus CB1 antagonist AM-251 (0.5 μM), CB2 antagonist AM-630 (0.5 μM), or vehicle. In parallel experiments, EC were directly stimulated by the general cannabinoid receptor agonist (R)-(+)-Methanandamide (1 μM), the CB1 agonist ACEA (0.5 μM), or the CB2 agonist BML-190 (5 μM). The data represent maximal increased TER (+/− S.E.M.) above baseline observed following stimulation (n=4–6 per condition). *p<0.001 vs. FTY alone (Vehicle).
Figure 8
Figure 8. Summary diagram outlining differential signaling pathways involved in FTY and S1P-induced EC barrier enhancement
Depicted on the left is a schematic representation of the major components involved in mediating S1P-induced endothelial cell barrier enhancement. Extracellular S1P ligates the Gi-coupled S1P1 receptor with subsequent Rac-dependent activation of multiple downstream effectors including cortactin, resulting in markedly increased cortical actin ring and rearrangement of focal adhesions [–4, 28, 41]. On the right, FTY-induced EC barrier enhancement requires intact membrane lipid rafts and is mediated through a Gi-coupled receptor, but in contrast to S1P, Rac-dependent effects such as cortactin translocation and cortical actin ring formation are not essential components. The downstream mechanisms responsible for FTY-induced EC barrier enhancement are still unclear, but the authors hypothesize that enhanced cell-cell (represented by cadherin-linked adherens junctions) [15] and cell-matrix (integrin-linked focal adhesions) may be involved.

Similar articles

Cited by

References

    1. Dudek SM, Garcia JGJ. Appl Physiol. 2001;91(4):1487–1500. - PubMed
    1. Garcia JG, Liu F, Verin AD, Birukova A, Dechert MA, Gerthoffer WT, Bamberg JR, English D. J Clin Invest. 2001;108(5):689–701. - PMC - PubMed
    1. Shikata Y, Birukov KG, Garcia JG. J Appl Physiol. 2003;94(3):1193–1203. - PubMed
    1. Dudek SM, Jacobson JR, Chiang ET, Birukov KG, Wang P, Zhan X, Garcia JG. J Biol Chem. 2004;279(23):24692–24700. - PubMed
    1. McVerry BJ, Peng X, Hassoun PM, Sammani S, Simon BA, Garcia JG. Am J Respir Crit Care Med. 2004;170(9):987–993. - PubMed

Publication types

MeSH terms