. 2007 Jul;18(7):2579-91.
doi: 10.1091/mbc.e06-11-0990. Epub 2007 May 2.

Ena/VASP proteins have an anti-capping independent function in filopodia formation

Affiliations

Ena/VASP proteins have an anti-capping independent function in filopodia formation

Derek A Applewhite et al. Mol Biol Cell. 2007 Jul.

Abstract

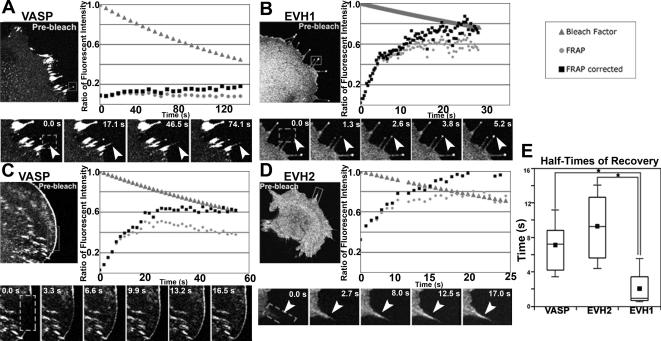
Filopodia have been implicated in a number of diverse cellular processes including growth-cone path finding, wound healing, and metastasis. The Ena/VASP family of proteins has emerged as key to filopodia formation but the exact mechanism for how they function has yet to be fully elucidated. Using cell spreading as a model system in combination with small interfering RNA depletion of Capping Protein, we determined that Ena/VASP proteins have a role beyond anticapping activity in filopodia formation. Analysis of mutant Ena/VASP proteins demonstrated that the entire EVH2 domain was the minimal domain required for filopodia formation. Fluorescent recovery after photobleaching data indicate that Ena/VASP proteins rapidly exchange at the leading edge of lamellipodia, whereas virtually no exchange occurred at filopodial tips. Mutation of the G-actin-binding motif (GAB) partially compromised stabilization of Ena/VASP at filopodia tips. These observations led us to propose a model where the EVH2 domain of Ena/VASP induces and maintains clustering of the barbed ends of actin filaments, which putatively corresponds to a transition from lamellipodial to filopodial localization. Furthermore, the EVH1 domain, together with the GAB motif in the EVH2 domain, helps to maintain Ena/VASP at the growing barbed ends.


Figures

Figure 1.
Figure 1.
Three characteristic spreading phenotypes. Phase-contrast (phase) and phalloidin-stained (actin) images. (A) Smooth-Edged phenotype. Characterized by a flat, evenly spreading leading edge (phase) enriched in actin as visualized by phalloidin staining. Scale bar, 10 μm. (B) Filopodial phenotype. Characterized by long actin-containing protrusions. (C) Ruffling phenotype. Characterized by phase-dense undulations with corresponding actin-rich regions.
Figure 2.
Figure 2.
Lamellipodial and filopodial markers in spreading cells. Low magnification images show actin distribution. Scale bar, 10 μm. High magnification images of boxed regions are presented to the right of the low magnification images. Scale bar, 2 μm. (A) Higher magnification of actin distribution (cyan), Arp 2/3 complex localized by immunostaining for Arp 3 (red), and a merge of the actin and Arp2/3 distributions (yellow) in a cell in the Smooth-Edged spreading phenotype. Arp 2/3 present at the spreading edge of the lamellipodia. (B) Actin distribution at high magnification (cyan), CP localized by immunostaining for the CPβ subunit (red) and a merged image of the actin and CP distributions (yellow) in a cell in the Smooth-Edged spreading phenotype. CP is present at the spreading edge of the lamellipodia. (C) Actin distribution at high magnification (cyan), fascin localized by expression of mCherry-fascin (red), and a merged image of actin and fascin (yellow) in a cell in the Filopodial spreading phenotype. Fascin colocalized with F-actin bundles present along the length of filopodia. (D) Actin distribution along the length of a filopodium (cyan), VASP localized by expression of EGFP-VASP in MVD7-VASP stable cell line (green), and the combination of actin and VASP distributions in the merged image (yellow) of a cell in the Filopodial phenotype. VASP is accumulated at tips of filopodia.
Figure 3.
Figure 3.
Cell-spreading assay, under normal conditions. In the cell-spreading assay, phenotypes were assessed by phase-contrast microscopy in live cells during the spreading phase (see Materials and Methods for detail). (A) The schematic diagram of the mutated/deleted Ena/VASP proteins represents the cell lines used in the assay. These proteins were stably expressed as EGFP-tagged form in MVD7 fibroblasts using retroviral vectors. The bar graph depicts percentage of cells displaying Smooth-Edged, Filopodial, and Ruffling phenotypes for each cell line. (B) The column bar graph represents the average percentages of the Smooth-Edged, Filopodial, and Ruffling phenotypes for groups containing or lacking wild-type EVH2 given in A. The average percentages of the three phenotypes in the EVH2-containing group were used for χ2-test for each line. The asterisks in A indicate statistical significance (p < 0.05).
Figure 4.
Figure 4.
Cell-spreading assay, CP-depleted. MVD7 and derivative cell lines were transfected with CPβ-depleting plasmid (pDsRed-SUPER-CPβ-T1), which expressed DsRed2 marker and shRNA against CPβ simultaneously. Four days after transfection, the phenotypes were assessed as in Figure 3. Transfectants were identified by DsRed-soluble marker. (A) The schematic diagram of the mutated/deleted Ena/VASP protein and the bar graph of the percentages of the Smooth-Edged, Filopodial, and Ruffling phenotypes. (B) The average percentages of the three phenotypic categories for the wild-type and mutant groups of MVD7 derivative cell lines given in A. The asterisks indicate statistically significant difference (p < 0.01, χ2-test) from the average of the wild-type group.
Figure 5.
Figure 5.
EVH2 domain is sufficient to induce filopodia in other cell lines. (A–D) Induction of filopodia by the EVH2 domain of VASP in COS7 cells. (A and B) F-actin organization of nontransfected (A) and EGFP-EVH2-expressing (B) COS7 cells. Phase-contrast and phalloidin-staining images are shown. Expression of the EVH2 domain induced numerous filopodia. (C) Immunostaining of fascin (middle panel; red in right panel) in COS7 cells overexpressing EGFP-EVH2 (left panel; green in right panel). The inset in right panel shows higher magnification of the boxed region. Fascin and EGFP-EVH2 are colocalized in dorsal filopodia. (D) Quantification of hyper-filopodial phenotype in COS7 cells. Bar graph indicates the percentage of the hyper-filopodial phenotype in cells expressing EGFP-control and EGFP-EVH2 (**p < 0.02, Student's t test, n = 3). (E–I) Overexpression of the EVH2 domain of VASP induces hyper-filopodial formation in B16F1 mouse melanoma cells. (E) F-actin staining (left panel; red in right panel) and EGFP-EVH2 (middle panel; green in right panel). EGFP-EVH2 localizes along the length of filopodia as well as stress fibers. Boxed region shows, at higher magnification, colocalization of EVH2 domain and actin. Scale bar, 10 μm. (F) Actin by phalloidin staining of a nontransfected control B16F1 displaying typical filopodial amounts and distributions. (G and H) Localization of the filopodial tip markers in EVH2-induced filopodia. B16F1 cell expressing EGFP-EVH2 (green), immunostained with anti-phospho-tyrosine (G, red) or anti-lamellipodin (H, red). F-actin (blue) was visualized by phalloidin staining. Scale bar, 10 μm. Boxed region is higher magnification of EVH2 induced filopodia. Scale bar, 2 μm. Both molecular markers were concentrated at the filopodia tips. (I) Box-and-whisker plot comparing the number of filopodia per B16F1 cell transiently expressing full-length VASP, EVH1 domain of VASP, EVH2 domain of VASP, and EGFP-control. The small square indicates the mean, the line in the middle of the box the median. The top of the box indicates the third quartile, the bottom of the both the first quartile. The upper and lower boundary of each whisker represents 90th and 10th percentile of the data respectively (*p < 0.02, one-way ANOVA).
Figure 6.
Figure 6.
Fluorescent recovery after photobleaching (FRAP) of VASP, EVH1, and EVH2 Domain of VASP. (A–D) Graphs are representative of FRAP data of the full-length VASP (A and C), the EVH1 domain (B), and the EVH2 domain (D). FRAP analysis are shown for filopodia (A, B, and D) and lamellipodia (C). In lower magnification images (top left) show the prebleach images. The regions indicated by gray rectangles are shown in the time series of fluorescence recovery (bottom). The white arrowheads indicate either filopodial tips (A and B) or shaft (D). Gray boxes denote the bleached regions subject to quantification. The fluorescence recovery for each sample was presented as a graph (top right). The gray triangles represent theoretical values of decrease in fluorescence intensity due to laser illumination during image acquisition. The gray circles represent fluorescent intensity normalized to the pre-bleached images. The black squares represent the relative intensity after correction for photofading during image acquisition. Time is given in seconds. (E) Box-and-whisker plot of the distribution of the half recovery times of FRAP analysis in the leading edges of lamellipodia (VASP), leading edge and filopodial shafts (EVH2), and filopodial tips (EVH1; *p < 0.001, Student's t test).
Figure 7.
Figure 7.
Co-FRAP of EGFP-VASP and mCherry-Actin. Sequential photobleaching of EGFP-VASP (cyan) and mCherry-Actin (red) of a protruding filopodium. Lower magnification image shows prebleach fluorescence image, with a cyan box representing the region of higher magnification. In higher magnification, time-lapsed fluorescence images are shown with the bleached region indicated by gray box. Two phase-contrast images at the beginning (top) and end (bottom) of time sequence, with black arrows denoting the tip of bleached filopodium. Note that the filopodium continued protrusion during the course of time- lapsed imaging.
Figure 8.
Figure 8.
FRAP of filopodial tips in MVD7-derivative stable cell lines. Time-lapsed fluorescence and phase-contrast images of photobleached filopodial tips in MVD7 derivative cell lines. (A) MVD7-VASP, (B) MVD7-GAB mutant (VASP), and (C) MVD7-ΔFAB(VASP). The first image of the fluorescence sequence shows the prebleached filopodium with gray boxes indicating the regions of quantification in Supplementary Figure 2. Phase-contrast images are shown at the prebleach and the final time points. Black arrows, which denote filopodial tips, demonstrate filopodia protrusion during image acquisition.
Figure 9.
Figure 9.
Model of Ena/VASP-initiated filopodia formation. (A) Ena/VASP molecules can be divided into two modules: membrane-interacting module and actin-interacting module. (B, 1–3) Initiation of filopodia by Ena/VASP proteins. (B, 1) Ena/VASP is recruited to membrane ligands via a transient association with the EVH1 domain. (B, 2) Additional interactions with the G-actin– and F-actin–binding domain help to stabilize molecule at filopodial tips. (B, 3) The complex formed between the G-actin–binding domain of Ena/VASP, the actin barbed end and G-actin is also somewhat transient in nature to allow for insertional polymerization. Collectively the interaction between the EVH1 domain and the membrane-bound ligand, the G-actin–binding domain, and the actin barbed end, and tetramerization of the coiled-coil domain allows for the entire molecule to be “static” and filopodial tips, but flexible enough to for continued insertional actin polymerization.

Similar articles

Cited by

References

    1. Adams J. C., Schwartz M. A. Stimulation of fascin spikes by thrombospondin-1 is mediated by the GTPases Rac and Cdc42. J. Cell Biol. 2000;150:807–822. - PMC - PubMed
    1. Ahern-Djamali S. M., Bachmann C., Hua P., Reddy S. K., Kastenmeier A. S., Walter U., Hoffmann F. M. Identification of profilin and src homology 3 domains as binding partners for Drosophila enabled. Proc. Natl. Acad. Sci. USA. 1999;96:4977–4982. - PMC - PubMed
    1. Albrecht-Buehler G. Filopodia of spreading 3T3 cells. Do they have a substrate-exploring function? J. Cell Biol. 1976;69:275–286. - PMC - PubMed
    1. Bachmann C., Fischer L., Walter U., Reinhard M. The EVH2 domain of the vasodilator-stimulated phosphoprotein mediates tetramerization, F-actin binding, and actin bundle formation. J. Biol. Chem. 1999;274:23549–23557. - PubMed
    1. Ballestrem C., Wehrle-Haller B., Imhof B. A. Actin dynamics in living mammalian cells. J. Cell. Sci. 1998;111(Pt 12):1649–1658. - PubMed

Publication types

MeSH terms