Comparative Study
. 2007 May 2;27(18):4984-94.
doi: 10.1523/JNEUROSCI.0615-07.2007.

Sensorimotor gating in larval zebrafish

Affiliations
Comparative Study

Sensorimotor gating in larval zebrafish

Harold A Burgess et al. J Neurosci. .

Abstract

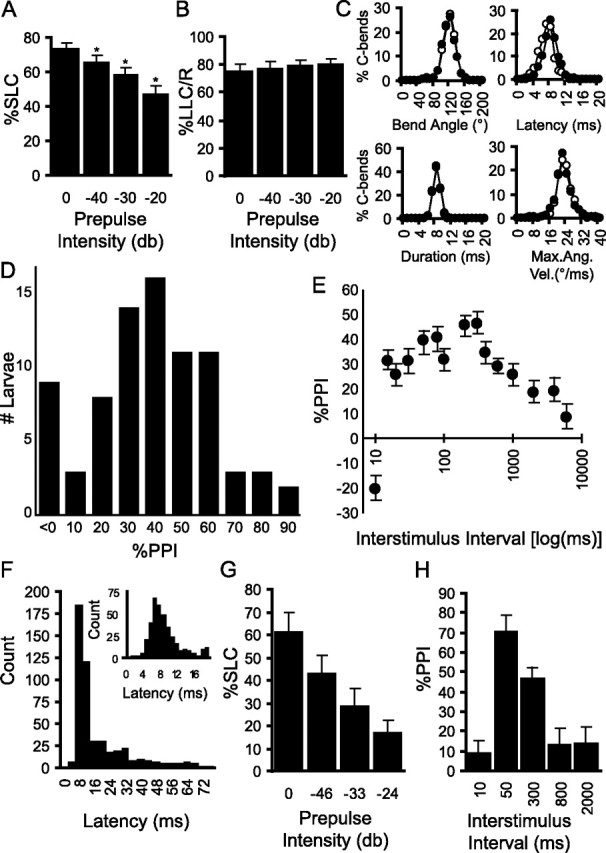
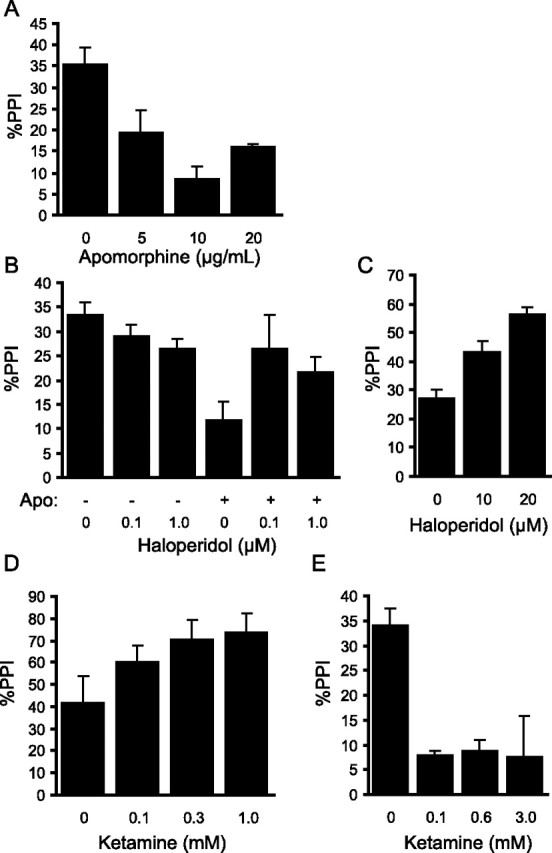
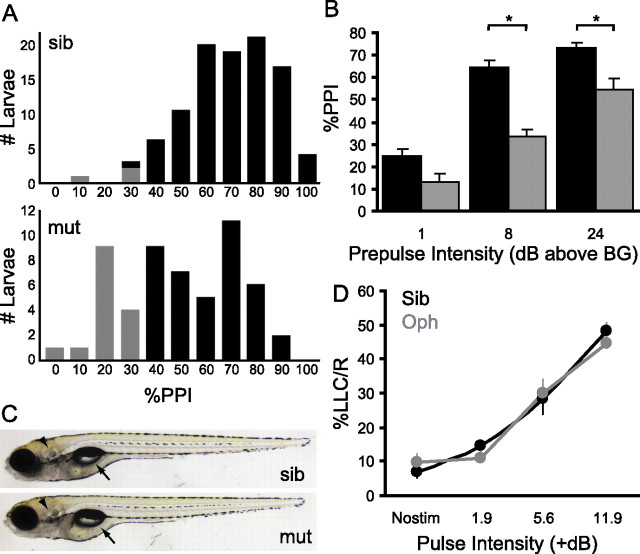
Control of behavior in the natural environment where sensory stimuli are abundant requires superfluous information to be ignored. In part, this is achieved through selective transmission, or gating of signals to motor systems. A quantitative and clinically important measure of sensorimotor gating is prepulse inhibition (PPI) of the startle response, impairments in which have been demonstrated in several neuropsychiatric disorders, including schizophrenia. Here, we show for the first time that the acoustic startle response in zebrafish larvae is modulated by weak prepulses in a manner similar to mammalian PPI. We demonstrate that, like in mammals, antipsychotic drugs can suppress disruptions in zebrafish PPI induced by dopamine agonists. Because genetic factors underlying PPI are not well understood, we performed a screen and isolated mutant lines with reduced PPI. Analysis of Ophelia mutants demonstrates that they have normal sensory acuity and startle performance, but reduced PPI, suggesting that Ophelia is critical for central processing of sensory information. Thus, our results provide the first evidence for sensorimotor gating in larval zebrafish and report on the first unbiased screen to identify genes regulating this process.


Figures

Figure 1.
Figure 1.
High throughput analysis of acoustic startle responses in zebrafish larvae. A, Behavioral tracking of multiple larvae. The positions of 18 zebrafish larvae (6 dpf) are shown in red tracks over 120 frames in response to an acoustic/vibrational stimulus (left). The vertical series (right) shows the startle response of a single larva, with the bar along the head segment indicating the orientation of the fish. B, Analysis of head orientation permits automated identification and measurement of responses. Response latency, C1 angle, and C1 duration are quantified as indicated.
Figure 2.
Figure 2.
Latency histograms for acoustic startle responses in zebrafish larvae are biphasic. A, Histogram of the latency to response for 19,993 startle trials. Whereas 78.6% of responses were initiated within 12 ms, remaining responses were initiated in a “second wave,” with a peak at 22 ms. All trials in this figure were conducted using a constant tap stimulus. B, Histograms of response kinematics and movement trajectories for short-latency responses (black) and long-latency responses (gray). C, Larvae tested individually with 30 trials per fish produced both SLC and LLC responses. Both TLF (triangles; n = 127) and Tu strain larvae (circles; n = 90) were capable of the two types of startle response. D, Kinematic parameters for short-latency C-bend (n = 5108) and long-latency C-bend (n = 2778) responses to acoustic startle stimuli (mean ± SD). Two-tailed t tests and significant differences for all parameters are presented, with p values < 10−20. Ang. Vel., Angular velocity.
Figure 3.
Figure 3.
Different characteristics of short- and long-latency C-bend startle responses. A, Fraction of larvae responding with SLCs (•) and LLC/Rs (■) to stimuli of increasing intensity (mean ± SEM). LLC/R is the fraction of larvae initiating an LLC response as a proportion of larvae not responding with an SLC. B, C-bend magnitude, maximal angular velocity (Max Ang. Vel.), and latency of SLCs (black) and LLCs (gray) to stimuli of increasing intensity. C, Reduced responsiveness of SLC and LLC responses during a series of 60 stimuli presented at 1 s intervals. Inset, C-bend magnitude of SLCs and LLCs across trials. Averages computed for 12 blocks of five stimuli. D, E, SLC responsiveness is potentiated in larvae engaged in locomotion at the time of the stimulus (gray) compared with those stationary at the beginning of a trial (black; D), whereas LLC/R responsiveness is not potentiated in moving larvae (gray) compared with stationary larvae (black; E). F, Keinstein mutants (white) show similar SLC responsiveness to siblings at low frequencies (left). G, In contrast, LLC/R responses are absent in kei at stimulus frequencies effective in wild-types and sibs. Error bars indicate mean percent PPI ± SEM. *p < 0.01 for mutants versus siblings. Stim., Stimulation; Sib, Sibling; Mut, mutant.
Figure 4.
Figure 4.
Mauthner cells are required for short- but not long-latency startle responses. A, Bilateral ablation of the Mauthner cells abolishes SLC responses in lesioned larvae (Lesion; n = 7). Robust SLC responsiveness is retained after ablation of other randomly selected, reticulospinal neurons (Control; n = 9). Larvae were tested with 60 trials (30 trials at each stimulus intensity, interleaved in a pseudorandom sequence) at 24 and 48 h after lesioning. Graph shows mean responsiveness for each group. Error bars indicate SEM. B, In the same experiment as in A, the two groups of larvae show nearly identical LLC responsiveness at both stimulus intensities. C, After unilateral ablation of one Mauthner cell, larvae produce SLC responses almost exclusively on the side ipsilateral to the ablation. Each larva was tested with a series of one hundred stimuli. We calculated the percentage of SLC responses that were initiated with a rightward C-bend. For control larvae (Control; n = 13), an average of 49.5% of responses were initiated in a rightward direction, indicating no directional bias. In contrast, only 7.7% of SLCs were right-directed in left Mauthner lesioned larvae (Left; n = 11; two-tailed t test, p = 0.0014 vs control), whereas 96.3% of SLCs were right-directed in right Mauthner lesioned larvae (Right; n = 9; two-tailed t test, p = 4.6 × 10⁻⁴ vs control). *p < 0.01 versus control. D, In the same experiment as in C, LLC responses made by lesioned larvae do not show directional bias. The slight reduction seen in rightward turns for right-lesioned larvae was neither significant (two-tailed t test, p = 0.067 vs control) nor reproducible in other experiments. E, Bilateral ablation of Mauthner cells does not affect the kinematics of LLC responses. LLC latency, bend angle, angular velocity (Max. Ang. Vel), and duration are almost identical in lesioned larvae (Les) and controls (Con). Kinematic data are taken from the experiment described in A. Graphs show the mean and SD. F–I, Confocal analysis was used to confirm complete ablation of the Mauthner cells. In wild-type larvae (F), both Mauthner cell bodies (each marked with an asterisk) and axons (arrows) are visible. The axon cap which is comprised of fibers from other neurons is also visible (arrowheads). In right Mauthner lesioned larvae (G), only the left Mauthner cell and axon remain. Both axon caps are clearly stained demonstrating that laser ablation has selectively killed the right Mauthner cell. Conversely, in left Mauthner ablations (H), only the right Mauthner cell and axon are visible. After bilateral ablation (I), neither Mauthner cell body or axon are stained. Scale bar, 20 μm.
Figure 5.
Figure 5.
Prepulse inhibition of the startle response in zebrafish. A, A weak prepulse reduces the fraction of larvae responding to a subsequent startle-inducing stimulus. Groups of larvae (n = 12) were exposed to 15 repeats of each of four conditions (startle stimulus alone, or preceded by identical but weaker stimuli with magnitude relative to the startle stimulus as indicated). SLC responses are significantly reduced at all prepulse intensities relative to stimulus-alone trials (*p < 0.001) B, LLC responses are not reduced in frequency by presentation of a prepulse. C, The prepulse stimulus does not alter the magnitude of the startle response. Histograms show the kinematic profile for 1000 C-bend responses to a startle stimulus (open circles) and 815 C-bend responses of the same larvae to prepulse plus stimulus trials (filled circles). Startle latency shows a small but significant delay in prepulse trials (F(1,1813) = 127; p < 10−7, one-way ANOVA), whereas histograms for other kinematic parameters are completely overlapping. Max. Ang. Vel., Maximum angular velocity. D, PPI is also exhibited by individual larvae. Of 80 larvae, robust inhibition of startle is present in all but nine fish. Four of the nine had unusually high or low SLC responsiveness (>95 or <30% respectively), suggesting that the lack of inhibition measured may have been attributable to ceiling and floor effects, respectively. E, The extent of the inhibition elicited by a prepulse varies with the interval between the prepulse and the tap stimulus. Groups of larvae (n = 29) were subjected to a startle stimulus alone, and the startle stimulus preceded by the prepulse at each of the indicated intervals. Inhibition was maximal at 300 ms. F, Latency histogram for startle responses in adult fish (TLF males, 1.5–2 years old) shows a single-tailed distribution different from the biphasic latency histogram for larvae (Fig. 2A). Additional analysis of long-latency responses did not reveal a distinct kinematic profile similar to larvae. Inset, Histogram of short-latency responses (<20 ms) G, Preceding a startle stimulus with weak prepulses of indicated relative intensity reduces startle responsiveness in adults. H, Analysis of startle inhibition when the prepulse preceded the startle stimulus at the indicated intervals. Reduced startle responsiveness compared with the no prepulse condition is significant only at the 50 and 300 ms interstimulus intervals (p = 1.0 × 10⁻⁴ and p = 0.014 respectively, two-tailed paired t test). Error bars indicate mean percent PPI ± SEM.
Figure 6.
Figure 6.
Dopaminergic and glutamatergic drugs modulate PPI in larval zebrafish. A, The mixed D1/D2 agonist apomorphine suppresses PPI in 6 dpf zebrafish larvae when added to the medium 10 min before testing (F(3,13) = 10.3; p = 9.6 × 10⁻⁴; n = 4 for each group except control, n = 5). B, Pretreatment of larva, 20 min before testing, with either 0.1 or 1.0 μm of the D2 antagonist haloperidol has no significant effect on PPI, but does block the disruption of PPI by apomorphine (two-factor ANOVA gives significant apomorphine by haloperidol interaction, F(2,35) = 3.3, p = 0.03; n = 6 for each group). C, At higher concentrations (10 and 20 μm), haloperidol enhances baseline PPI (F(2,21) = 21.8; p = 7.6 × 10⁻⁶; n = 8, each group). D, The NMDA receptor antagonist ketamine augments PPI when the prepulse is given 30 ms before the startle stimulus (F(3,22) = 15.5; p = 1.2 × 10⁻⁵; n = 6 for each group except control, n = 8). E, Ketamine disrupts PPI at 500 ms interstimulus interval (F(3,20) = 8.3; p = 8.7 × 10⁻⁴; n = 6, each group). Error bars indicate mean percent PPI ± SEM.
Figure 7.
Figure 7.
Reduced PPI in ophelia mutant larvae. A, Distribution of percent PPI among larvae in an ophelia mutant clutch compared with larvae from a wild-type sibling clutch. In a wild-type clutch (top), PPI was 64.0 ± 17.8% (mean ± SD). Only 3 of 97 (3%) of these larvae had a PPI value less than two SDs from the mean (i.e., <28.4%). In the ophelia clutch, 15 of 55 larvae (27%, gray) had a PPI of <28.4%. B, At day 7, Ophelia mutants (gray) continue to show reduced inhibition compared with normal siblings from the same clutch (black) at all prepulse intensities (for statistics, see Results) (*p < 0.01) C, Ophelia mutants are morphologically normal, with inflated swim bladders (arrows) and well formed otic vesicles (arrowheads). D, Ophelia mutants (Oph) and siblings show identical levels of spontaneous activity (Nostim) and LLC responsiveness to weak pulses. Error bars indicate mean percent PPI ± SEM. sib, Sibling; mut, mutant.

Similar articles

Cited by

References

    1. Abel KM, Allin MP, Hemsley DR, Geyer MA. Low dose ketamine increases prepulse inhibition in healthy men. Neuropharmacology. 2003;44:729–737. - PubMed
    1. Anholt RR, Mackay TF. Quantitative genetic analyses of complex behaviours in Drosophila. Nat Rev Genet. 2004;5:838–849. - PubMed
    1. Anokhin AP, Heath AC, Myers E, Ralano A, Wood S. Genetic influences on prepulse inhibition of startle reflex in humans. Neurosci Lett. 2003;353:45–48. - PubMed
    1. Blumenthal TD, Goode CT. The startle eyeblink response to low intensity acoustic stimuli. Psychophysiology. 1991;28:296–306. - PubMed
    1. Blumenthal TD, Elden A, Flaten MA. A comparison of several methods used to quantify prepulse inhibition of eyeblink responding. Psychophysiology. 2004;41:326–332. - PubMed

Publication types

LinkOut - more resources