Comparative Study
. 2007 May 15;178(10):6332-41.
doi: 10.4049/jimmunol.178.10.6332.

Basal B cell receptor-directed phosphatidylinositol 3-kinase signaling turns off RAGs and promotes B cell-positive selection

Affiliations
Comparative Study

Basal B cell receptor-directed phosphatidylinositol 3-kinase signaling turns off RAGs and promotes B cell-positive selection

Laurent Verkoczy et al. J Immunol. .

Abstract

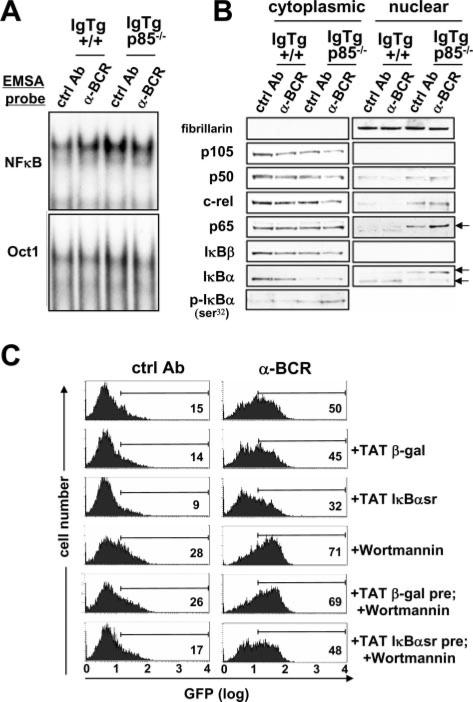
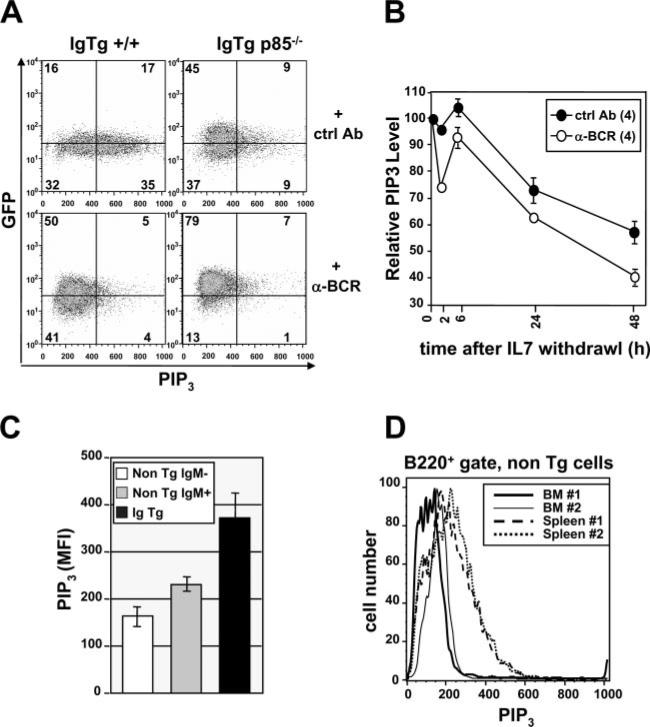
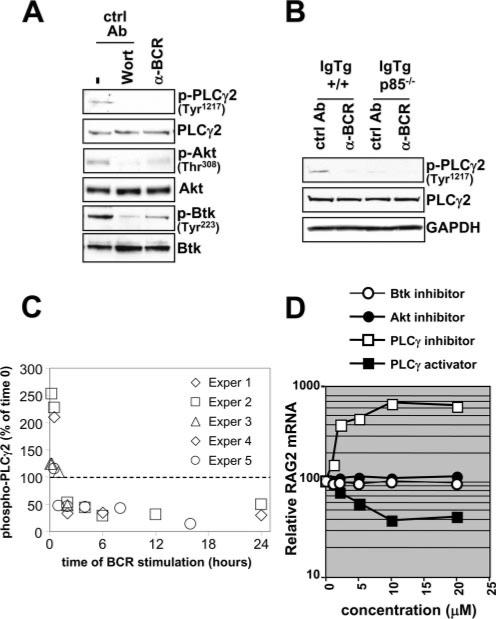
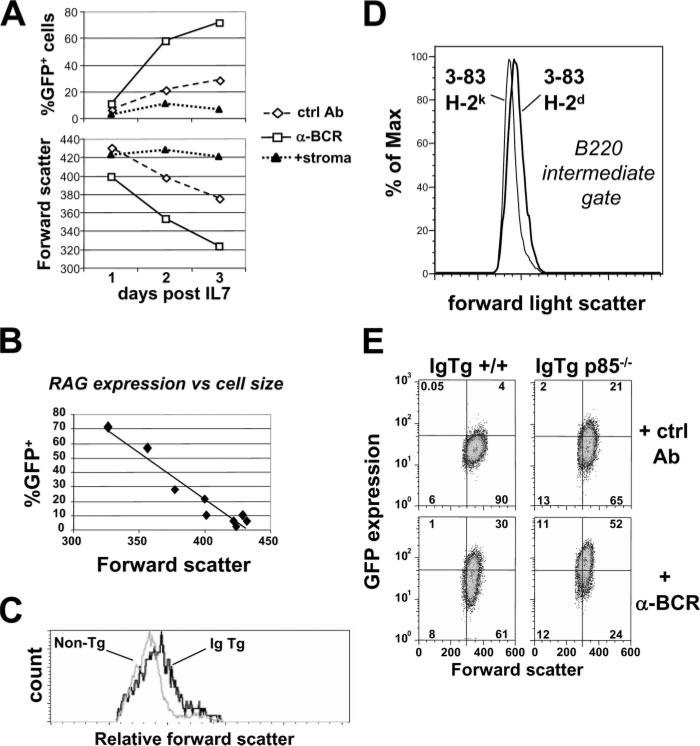
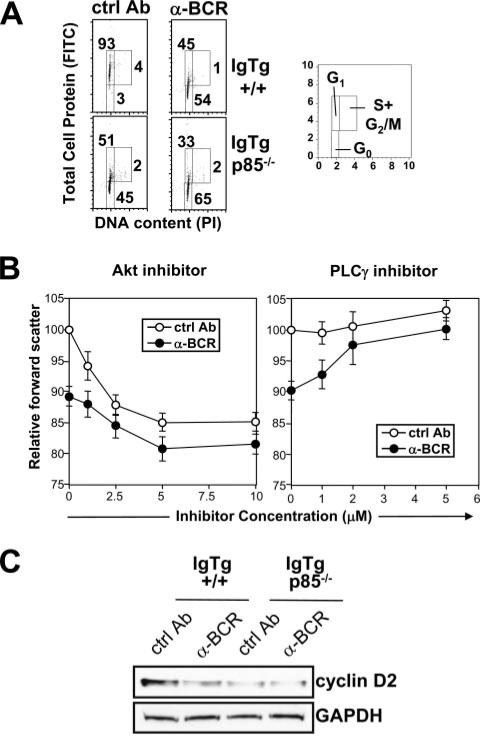
PI3K plays key roles in cell growth, differentiation, and survival by generating the second messenger phosphatidylinositol-(3,4,5)-trisphosphate (PIP3). PIP3 activates numerous enzymes, in part by recruiting them from the cytosol to the plasma membrane. We find that in immature B lymphocytes carrying a nonautoreactive Ag receptor, PI3K signaling suppresses RAG expression and promotes developmental progression. Inhibitors of PI3K signaling abrogate this positive selection. Furthermore, immature primary B cells from mice lacking the p85alpha regulatory subunit of PI3K suppress poorly RAG expression, undergo an exaggerated receptor editing response, and, as in BCR-ligated cells, fail to progress into the G1 phase of cell cycle. Moreover, immature B cells carrying an innocuous receptor have sustained elevation of PIP3 levels and activation of the downstream effectors phospholipase C (PLC)gamma2, Akt, and Bruton's tyrosine kinase. Of these, PLCgamma2 appears to play the most significant role in down-regulating RAG expression. It therefore appears that when the BCR of an immature B cell is ligated, PIP3 levels are reduced, PLCgamma2 activation is diminished, and receptor editing is promoted by sustained RAG expression. Taken together, our results provide evidence that PI3K signaling is an important cue required for fostering development of B cells carrying a useful BCR.


Figures

FIGURE 1
FIGURE 1
Innocuous BCR signal promotes protein tyrosine phosphorylations that are inhibited by prolonged BCR cross-linking. IL-7-cultured 3-83 Tg bone marrow B cells were treated after IL-7 withdrawal for the indicated times with either anti-BCR or control Abs. A, Total tyrosinephosphorylated proteins assessed in Western blot with 4G10 Ab. Lower panel, Shows signal of stripped blot reprobed with GAPDH Ab. B, Analysis of CD19 tyrosine phosphorylation and total CD19 levels of immunoprecipitated CD19 (left panels) compared with whole cell lysates (right panels).
FIGURE 2
FIGURE 2
In vivo analysis of BCR and CD19 expression in bone marrow B cells undergoing positive and negative selection. The 3-83 (anti-H-2Kk,b) BCR Tg mice were bred to H-2d (B10.D2) or H-2k (B10.BR) backgrounds, and their bone marrow cells were analyzed by flow cytometry for the indicated markers. Viable (upper panels) or fixed and permeabilized (lower panels) cells were stained for expression of CD19 and Igκ. Lower panels, Show relative mean fluorescence intensity (MFI) for the two markers within the indicated boxes. Contour plots show data from bone marrow cells using a lymphocyte gate.
FIGURE 3
FIGURE 3
Effect of PI3K inhibitors on RAG expression in immature B cells carrying ligated or unligated BCR. A, Experimental design. B, Effect of inhibitors on RAG1 and RAG2 expression as assessed by Northern blot. The 3-83 Tg bone marrow B cells cultured for 24 h in the presence of control Ab (upper panel) or anti-BCR (lower panel) alone (untreated, lane 1) or for the last 6 h with 50 nM wortmannin, 7.5 μM LY294002, 100 nM rapamycin, 10 μM SB203580, 20 μM PD98059, 1 μg/ml cyclosporin A, and 100 ng/ml FK506 (lanes 2–8, respectively). Molecular targets of each inhibitor (—) are indicated above each lane. For both groups (control Ab and anti-BCR), relative RAG1 and RAG2 mRNA signal (calculated by normalizing RAG signal to 18S RNA content and setting untreated samples at 100%) is shown under each lane. Data are representative of at least three experiments. C, Dose/Response analysis of the effect of a specific inhibitor of the PI3K p110δ catalytic component (IC87114) on RAG1 and RAG2 expression.
FIGURE 4
FIGURE 4
Analysis of RAG expression and L chain gene recombinations in p85-deficient 3-83 bone marrow B cell cultures and primary ex vivo cells. A, Northern analysis of RAG expression in BCR-stimulated and control cells that were either p85 deficient or sufficient. Lower panel, Shows ethidium bromide-stained gel before transfer to assess RNA loading. B, Statistical summary of changes in RAG2 mRNA expression over multiple experiments. C, Assessment of cell recovery in 3-83/p85–/– and 3-83/p85+/+ cultured cells at time of harvest for mRNA analysis (24 h post-IL-7 withdrawal). D, PCR analysis of L chain and RS recombinations in genomic DNA of B cells cultured with and without BCR ligation for 2 days post-IL-7 withdrawal. E, Elevated RAG expression in p85–/– B cells in vivo as assessed using a GFP reporter. B cells were from 3-83 Tg/RAG2-GFP background that either were p85+/+ or p85–/–. B220-gated cells from bone marrow or spleen of the indicated mice were assessed for GFP expression by flow cytometry. Note that cells from two independent mice/group were analyzed.
FIGURE 5
FIGURE 5
Immunoblot and EMSA analysis of NF-κB activation in p85–/– and p85+/+ immature B cells. IL-7-expanded bone marrow B cells were treated for 24 h in the absence of IL-7 with control or anti-BCR Ab before assay. A, Nuclear extracts were incubated with the indicated radio-labeled probes and mobility shift monitored on polyacrylamide gels. B, Western blots of nuclear and cytoplasmic protein fractions of the indicated cell populations were probed with Abs to the indicated epitopes. Immunoblotting for the nuclear-localized protein fibrillarin was performed to confirm purity of preparations. C, Effect of membrane-permeable, super-repressive IκBα (TAT-IκBαsr) on wortmannin- and BCR-induced RAG expression. Immature 3-83/RAG2-GFP B cells obtained after IL-7 culture were treated with control or anti-BCR Ab for 48 h. IκBα-TAT or control β-gal-TAT fusion proteins were added at 22 h and wortmannin at 24 h. Flow cytometry analysis for GFP reporter expression was conducted at 48 h. At the time points surveyed under these conditions, survival in the presence of TAT-IκBαsr did not differ >10% compared with cultures not receiving TAT fusion protein.
FIGURE 6
FIGURE 6
Flow cytometry analysis of PIP3 levels in immature B cells. A, IL-7-cultured 3-83 Ig/RAG2-GFP B cells of the indicated p85 genotypes were treated for 48 h after IL-7 withdrawal with control or anti-BCR Abs, then fixed, permeabilized, and assayed by flow cytometry for intracellular PIP3 levels and GFP reporter expression (as a measure of RAG2 transcription). Data are representative of three separate experiments. B, Time course analysis of PIP3 levels plotted as mean fluorescence intensity (MFI) values, relative to samples at time zero of IL-7 withdrawal, plotted as a function of time. Shown are means and SDs from four independent experiments. C, PIP3 levels in B220int-gated ex vivo bone marrow cells from non-Tg or 3-83 IgTg mice, as analyzed by flow cytometry. Data represent results from three independent mice/group. D, Intra-cellular staining for PIP3 levels from ex vivo wild-type splenic B cells compared with bone marrow pre-B cells taken from the same animals, showing increase in PIP3 levels in sIg+ cells.
FIGURE 7
FIGURE 7
Analysis of phosphorylations of proteins recruited by PIP3 in positively selecting and BCR-treated immature B cells and relationship to regulation of RAG expression. A, Immunoblot analysis of activating phosphorylations of PLCγ2, Akt, and Btk. B, Assessment of altered phosphorylation patterns in p85α-deficient B cells compared with wild-type controls. C, PLCγ2 Tyr1217 phosphorylation levels in ex vivo bone marrow B cells at various times post-BCR stimulation. The y-axis indicates levels relative to that obtained at time zero of stimulation. D, Effects of pharmacological manipulation of PIP3-recruited enzymes on RAG expression in immature B cells. RAG expression was determined by Northern blot. Similar results were seen in two additional experiments.
FIGURE 8
FIGURE 8
Relationship between cell size and RAG expression in immature B cells. A, Inverse correlation between RAG expression and cell size in immature B cells treated with control Ab or anti-BCR. Bone marrow B cells of 3-83 IgTg/RAG2-GFP mice were stimulated by BCR Abs, control Abs, or a stromal cell line lacking BCR ligand for the indicated times after IL-7 withdrawal. Cells were assayed for GFP expression (upper panel) and forward scatter (lower panel). B, Data from A replotted to show relationship between %GFP+ cells and forward scatter. C, Comparison of forward scatter in ex vivo analyzed immature B cells carrying an innocuous receptor (B220int/IgM+ bone marrow cells from IgTg mice) and pre-B cells (B220int/IgM bone marrow cells from wild-type mice). D, Comparison of forward light scatter in negatively selecting (3-83/H-2k) and positively selecting (3-83/H-2d) ex vivo bone marrow B cells gated on B220int/sIgκ+ cells. E, Dot plot analysis of GFP expression vs cell size in p85–/– and p85+/+ IgTg B cells. Relative geometric means of fluorescence intensity were as follows: IgTg ctrl (GFP 23; forward scatter 378); IgTg anti-BCR (GFP 34; forward scatter 331); IgTg p85–/– ctrl (GFP 31; forward scatter 337); IgTg p85–/– anti-BCR (GFP 77; forward scatter 316).
FIGURE 9
FIGURE 9
A, Cell cycle analysis of BCR-ligated and control Ig-treated immature B cells from p85-deficient and -sufficient IgTg mice. Two-color analysis of total cell protein and DNA content, conducted as described (64). Right panel, Indicates cell cycle compartments distinguished in the analysis. B, Effect of Akt inhibitor (Akt inhibitor) and PLCγ inhibitor (U73122) on forward scatter characteristics of BCR-treated and control Ig-treated immature B cells. C, Western blot analysis of cyclin D levels in immature B cells taken at 24 h post-IL-7 withdrawal in the presence of the indicated Abs.

References

    1. Lam KP, Kuhn R, Rajewsky K. In vivo ablation of surface immunoglobulin on mature B cells by inducible gene targeting results in rapid cell death. Cell. 1997;90:1073–1083. - PubMed
    1. Kraus M, Alimzhanov MB, Rajewsky N, Rajewsky K. Survival of resting mature B lymphocytes depends on BCR signaling via the Igαβ heterodimer. Cell. 2004;117:787–800. - PubMed
    1. Goodnow CC, Crosbie J, Adelstein S, Lavoie TB, Smith-Gill SJ, Brink RA, Pritchard-Briscoe H, Wotherspoon JS, Loblay RH, Raphael K, et al. Altered immunoglobulin expression and functional silencing of self-reactive B lymphocytes in transgenic mice. Nature. 1988;334:676–682. - PubMed
    1. Russell DM, Dembic Z, Morahan G, Miller JF, Burki K, Nemazee D. Peripheral deletion of self-reactive B cells. Nature. 1991;354:308–311. - PMC - PubMed
    1. Fulcher DA, Basten A. Reduced life span of anergic self-reactive B cells in a double-transgenic model. J. Exp. Med. 1994;179:125–134. - PMC - PubMed

Publication types

MeSH terms