. 2007 Jun 20;26(12):2880-9.
doi: 10.1038/sj.emboj.7601715. Epub 2007 May 3.

Cooperative interactions between CBP and TORC2 confer selectivity to CREB target gene expression

Affiliations

Cooperative interactions between CBP and TORC2 confer selectivity to CREB target gene expression

Kim Ravnskjaer et al. EMBO J. .

Abstract

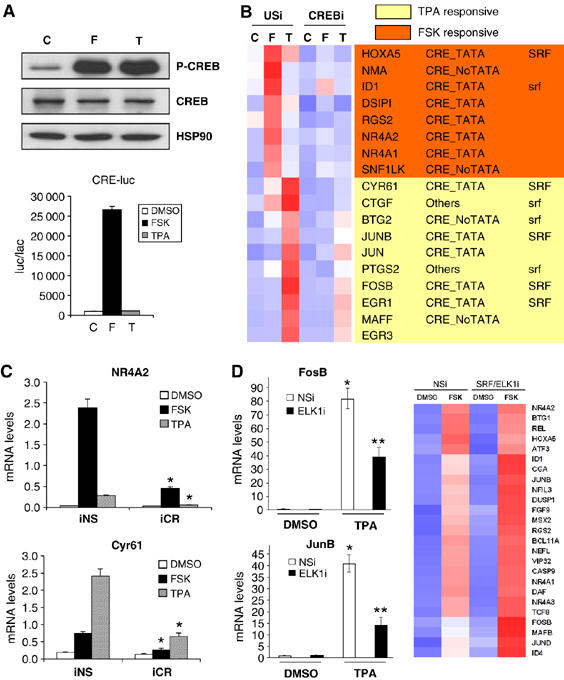
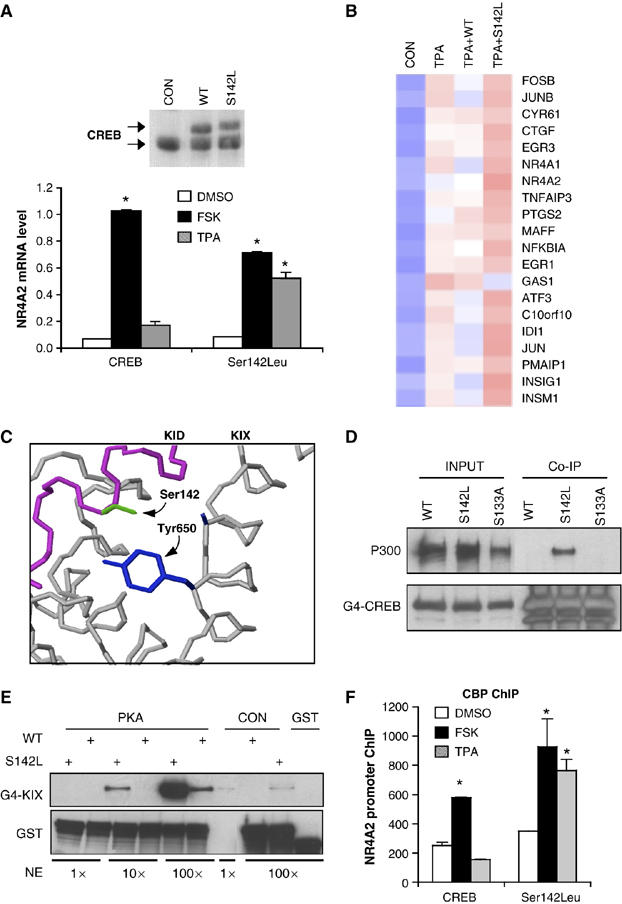
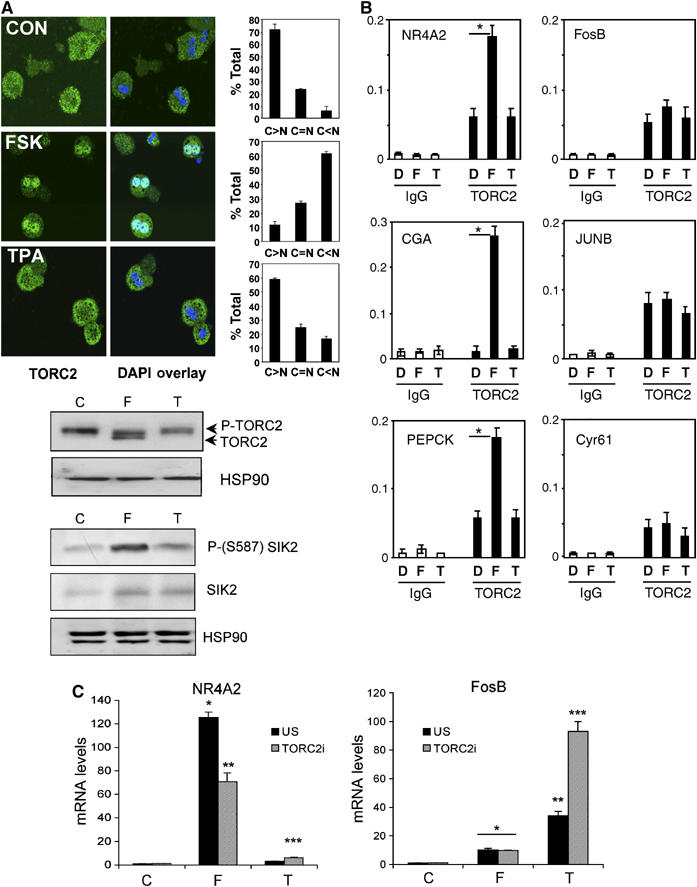
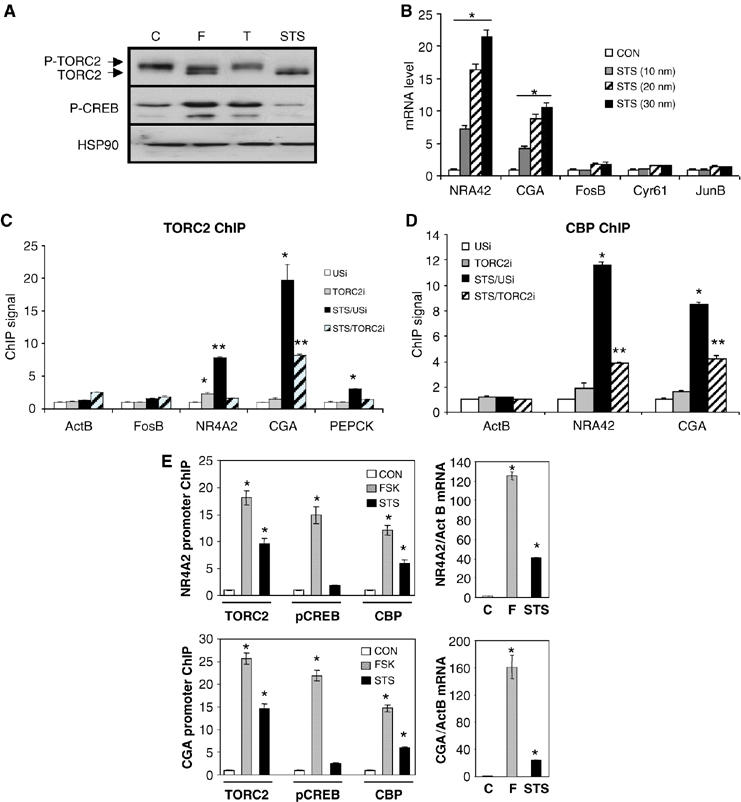
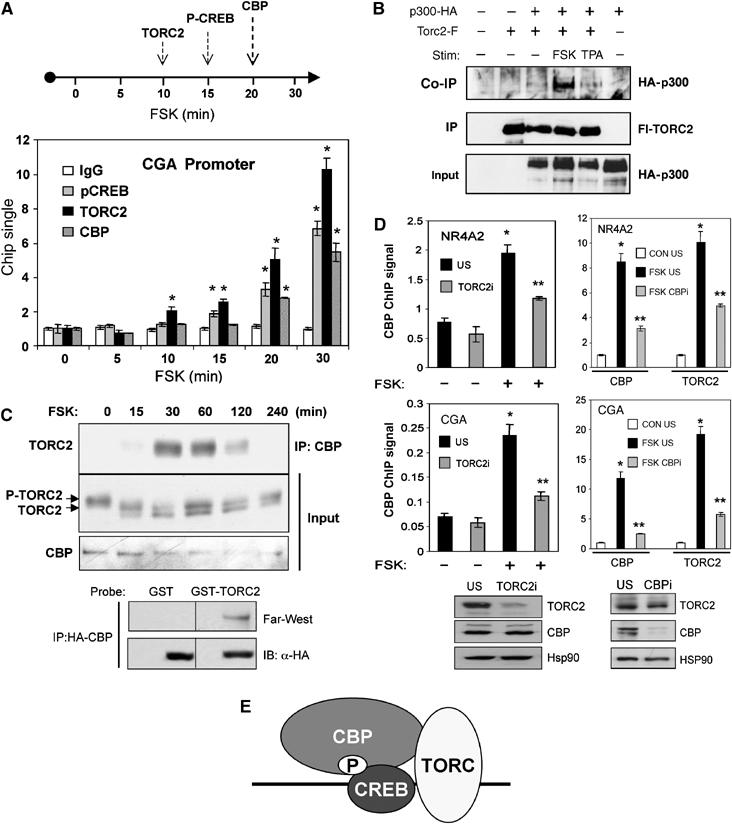
A number of hormones and growth factors stimulate gene expression by promoting the phosphorylation of CREB (P-CREB), thereby enhancing its association with the histone acetylase paralogs p300 and CBP (CBP/p300). Relative to cAMP, stress signals trigger comparable amounts of CREB phosphorylation, but have minimal effects on CRE-dependent transcription. Here, we show that the latent cytoplasmic coactivator TORC2 mediates target gene activation in response to cAMP signaling by associating with CBP/p300 and increasing its recruitment to a subset of CREB target genes. TORC2 is not activated in response to stress signals, however; and in its absence, P-CREB is unable to stimulate CRE-dependent transcription, due to a block in CBP recruitment. The effect of TORC2 on CBP/p300 promoter occupancy appears pivotal because a gain of function mutant CREB polypeptide with increased affinity for CBP restored CRE-mediated transcription in cells exposed to stress signals. Taken together, these results indicate that TORC2 is one of the long sought after cofactors that mediates the differential effects of cAMP and stress pathways on CREB target gene expression.


Figures

Figure 1
Figure 1
cAMP and stress signals trigger distinct CREB-regulated gene programs. (A) Relative effect of FSK(10 μM, 20 min) and TPA (20 nM, 20 min) on amounts of phospho (Ser133) CREB (P-CREB) (top) and on CRE-luciferase (CRE-luc) reporter activity in HEK293T cells (bottom). (B) Heat map from gene profiling assay of HEK293T cells exposed to FSK or TPA. Effect of CREB knockdown with CREB RNAi shown relative to unspecific (US) RNAi expression vector. Effect of CREB RNAi on amounts of CREB protein shown in Supplementary Figure 1. Presence of conserved (mouse, rat, human) CRE and TATA box (CRE-TATA/ CRE-noTATA); SRF binding sites that are conserved in mouse, rat and human orthologs (SRF) or present only in human (srf) indicated. Gene profiling data provided in Supplementary Table 1. (C) Q-PCR analysis of genes induced selectively by FSK (NR4A2) or TPA (Cyr61) in gene profiling assay. Effect of CREB and nonspecific RNAi (iCR, iNS) on mRNA levels shown. Treatment with FSK, TPA or vehicle as indicated (*significantly different from iNS (P<0.05); n=3). (D) Left: Q-PCR assay showing effect of ELK1 RNAi on mRNA amounts for stress-inducible (FosB, JunB) genes under basal conditions (DMSO) and in response to TPA. Effect of ELK1 RNAi on amounts of ELK1 protein shown in Supplementary Figure 1. Right: heat map from gene profiling assay showing effect of nonspecific or SRF+ELK1 RNAis on expression of CREB target genes in HEK293T cells exposed to FSK as indicated (* and ** differ significantly (P<0.05) and from DMSO (two-way ANOVA; n=3)). Gene profiling data included in Supplementary Table 1.
Figure 2
Figure 2
A gain-of-function CREB mutant with increased affinity for CBP/p300 stimulates CRE-dependent transcription comparably in response to cAMP and stress signals. (A) Top: Western blot assay amounts of endogenous and retroviral epitope-tagged wild-type (WT) or Ser142Leu (S142L) mutant CREB in infected HEK293T cells. Bottom: Q-PCR assay comparing effects of FSK and TPA on NR4A2 mRNA levels in HEK293T cells expressing WT and Ser142Leu mutant CREB (*significantly different from DMSO (P<0.05); n=2). (B) Heat map showing relative effects of WT and S142L mutant CREB on target gene expression compared to control (untransfected) HEK293T cells following exposure to TPA. Blue color indicates low-level expression and red indicates high mRNA expression. Gene profiling data included in Supplementary Table 1. (C) Ser142 in CREB is directed toward a hydrophobic pocket in the KIX domain of CBP. Partial structure of the KID/KIX complex showing relative position of Ser142 in CREB pointing toward a hydrophobic pocket containing Tyr650 in KIX. (D) Western blot assay showing amounts of endogenous p300 recovered from IPs of WT, phosphorylation-defective (S133A), and S142L mutant GAL4-CREB (aa 1–283) polypeptides, lacking the TORC2 binding domain (bZIP; aa 283–341) in HEK293T cells cotransfected with PKA expression plasmid. Input amounts of GAL4-CREB fusion proteins are shown. (E) Pull-down assays showing recovery of a CBP KIX domain polypeptide (G4-KIX) from nuclear extracts following incubation with glutathione–sepharose beads containing WT or Ser142Leu mutant GST-CREB (aa 1–283) proteins which lack the TORC2 interacting bZIP domain (aa 283–341). Effect of PKA phosphorylation of GST-CREB on KIX binding is indicated. Incubation with increasing amounts of nuclear extract (1 × , 10 × , 100 ×) is shown. (F) ChIP assay showing effect of WT and Ser142Leu CREB on recruitment of CBP to the NR4A2 promoter following treatment with FSK or TPA. (*significantly different (P<0.05) from DMSO control; n=2).
Figure 3
Figure 3
The coactivator TORC2 mediates the selective induction of cAMP but not stress responsive CREB target genes. (A) Relative effects of TPA and FSK on subcellular localization and phosphorylation status of TORC2. Top: immunofluorescence analysis of endogenous TORC2 protein in cultured primary mouse hepatocytes exposed for 30 min to FSK (10 μM), TPA (20 nM) or DMSO vehicle. DAPI staining shows double nuclei, which are characteristic of hepatocytes (Kachi and French, 1994). Right: bar graphs showing proportion of cells with nuclear (N>C), cytoplasmic (N<C) or ubiquitous (N=C) staining (out of 100 cells counted on each of two different slides for each condition). Middle: Western blot assay showing amounts of phospho- and dephospho-TORC2 in cells exposed to FSK, TPA or control vehicle (20 min). Phospho- and unphospho-TORC2 bands are indicated. Bottom: Western blot showing amounts of total and phospho (Ser587) SIK2 in HEK293T cells exposed to FSK, TPA or control vehicle (20 min). (B) ChIP assay of HEK293T cells showing relative effects of TPA (T) and FSK (F) compared with DMSO vehicle (D) on recruitment of endogenous TORC2 to cAMP responsive (left; NR4A2, CGA, PEPCK) or TPA inducible (right; FosB, JunB, Cyr61) CREB target genes (*significantly different from DMSO (P<0.05); n=2). ChIPs with control IgG are shown. Results are representative of three independent experiments. (C) Effect of TORC2 (TORC2i) or nonspecific (US) RNAi on amounts of mRNA for cAMP inducible (NR4A2) and TPA responsive (FosB) CREB target genes (*, **, and *** differ significantly from each other (P<0.05) and from control (C) (two-way ANOVA; n=3)).
Figure 4
Figure 4
TORC2 dephosphorylation is sufficient to promote CBP recruitment and transcription of cAMP responsive CREB target genes. (A) Western blot assay showing amounts of phospho- and unphospho-TORC2 compared with P-CREB in HEK293T cells exposed to cAMP agonist (F: 10 μM), TPA (T: 20 nM) or staurosporine (STS: 30 nM) for 1 h. Amounts of HSP90 shown for comparison. (B) Q-PCR assay showing effects of STS on mRNA levels for cAMP responsive (NR4A2, CGA) or TPA inducible (FosB, Cyr61, JunB) genes in HEK293T cells exposed to STS (0, 10, 20, 30 nM) for 2 h (* for each gene significantly different from DMSO control (P<0.05); n=3). (C) ChIP assay showing effect of STS (30 nM) on recruitment of TORC2 to cAMP responsive (NR4A2, CGA, PEPCK), TPA-responsive (FosB), or constitutively active (ActB) promoters. Effect of unspecific (USi) and TORC2 RNAi on TORC2 occupancy is indicated (* and ** for each gene differ significantly from each other (P<0.05) and from USi (two-way ANOVA; n=2)). (D) Effect of STS (30 nM) on recruitment of CBP to cAMP responsive (NR4A2 and CGA) or control (ActB) promoters. Effect of unspecific and TORC2 RNAi on CBP occupancy is indicated. (E) Left: ChIP assay showing relative effects of FSK, STS (30 nM) and DMSO vehicle (30 min stimulation) on occupancy of TORC2, P-CREB and CBP over cAMP responsive NR4A2 and CGA genes. Right: Q-PCR analysis of NR4A2 and CGA mRNA levels from HEK293T cells following stimulation with FSK or STS (*significantly different from DMSO control (P<0.05); n=3).
Figure 5
Figure 5
TORC2 is required for recruitment of CBP/p300 to cAMP responsive promoters. (A) ChIP assay of HEK293T cells exposed to FSK for the times indicated. Amounts of P-CREB, TORC2 and CBP associated with the cAMP inducible CGA promoter at each time point shown (*significantly different from t=0; P<0.05; n=2). Time line showing relative kinetics of TORC2, P-CREB and CBP recruitment to the CBP promoter indicated above. (B) Western blot assay of immunoprecipitates from Fl-TORC2 showing amounts of HA-tagged p300 associated with TORC2 following exposure of HEK293T cells to FSK (F: 10 μM) or TPA (T: 100 nM) for 1 h. Input levels of Fl-TORC2 and HA-p300 are shown. (C) Top: effect of FSK on the association of endogenous TORC2 with CBP in primary mouse hepatocytes. Western blot assay showing amounts of TORC2 in IPs of CBP recovered from cells following exposure to FSK for times indicated (in minutes). Input: amounts of endogenous phospho and unphospho-TORC2 and CBP proteins are shown. Bottom: Far-Western blot assay of HA-CBP immunoprecipitates prepared from HEK293T cells. Total amount of CBP in each IP is indicated. Blots were incubated with recombinant GST-TORC2 or GST proteins, and then probed with anti-GST antiserum. (D) Effect of TORC2 RNAi (left) and CBP RNAi (right) compared to nonspecific RNAi (US) on amounts of CBP and TORC2 associated with the cAMP responsive NR4A2 and CGA promoters under basal conditions and following FSK stimulation (* and ** for each gene differ significantly from each other (P<0.05) and from USi (two-way ANOVA; n=2)). Bottom: Western blots showing effects of each RNAi on amounts of TORC2 and CBP proteins. (E) cAMP stimulates CREB target gene expression through cooperative interactions between CBP and TORC2.

Similar articles

Cited by

References

    1. Asahara H, Santoso B, Du K, Cole P, Montminy M (2001) Chromatin dependent cooperativity between constitutive and inducible activation domains in CREB. Mol Cell Biol 21: 7892–7900 - PMC - PubMed
    1. Bittinger MA, McWhinnie E, Meltzer J, Iourgenko V, Latario B, Liu X, Chen CH, Song C, Garza D, Labow M (2004) Activation of cAMP response element-mediated gene expression by regulated nuclear transport of TORC proteins. Curr Biol 14: 2156–2161 - PubMed
    1. Bonni A, Ginty D, Dudek H, Greenberg M (1995) Serine 133 phosphorylated CREB induces transcription via a cooperative mechanism that may confer specificity to neurotrophin signals. Mol Cell Neurosci 6: 168–183 - PubMed
    1. Brindle P, Linke S, Montminy M (1993) Analysis of a PK-A dependent activator in CREB reveals a new role for the CREM Family of repressors. Nature 364: 821–824 - PubMed
    1. Brindle P, Nakajima T, Montminy M (1995) Multiple protein kinase A-regulated events are required for transcriptional induction by cAMP. Proc Natl Acad Sci USA 92: 10521–10525 - PMC - PubMed

Publication types

MeSH terms