. 2007 May 2;2(5):e401.
doi: 10.1371/journal.pone.0000401.

Controlling pandemic flu: the value of international air travel restrictions

Affiliations

Controlling pandemic flu: the value of international air travel restrictions

Joshua M Epstein et al. PLoS One. .

Abstract

Background: Planning for a possible influenza pandemic is an extremely high priority, as social and economic effects of an unmitigated pandemic would be devastating. Mathematical models can be used to explore different scenarios and provide insight into potential costs, benefits, and effectiveness of prevention and control strategies under consideration.

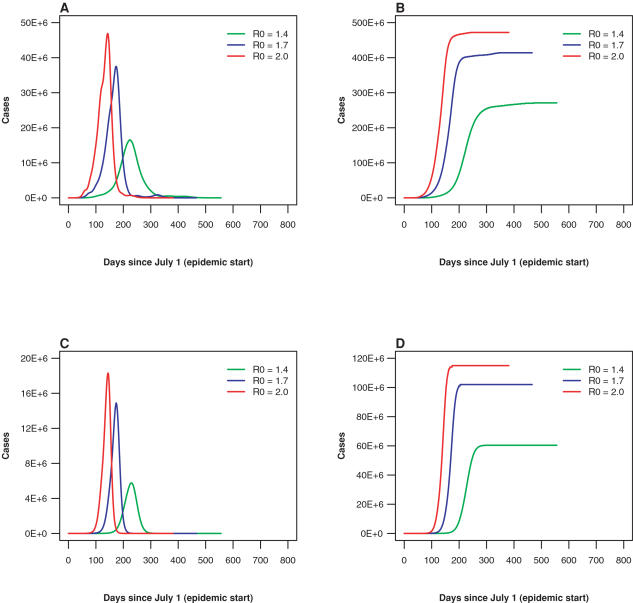
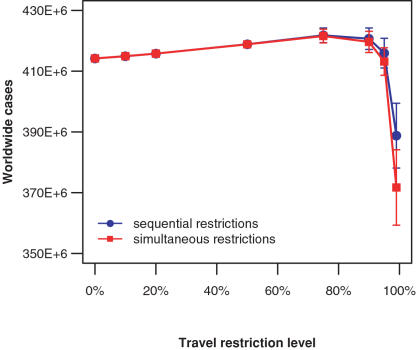
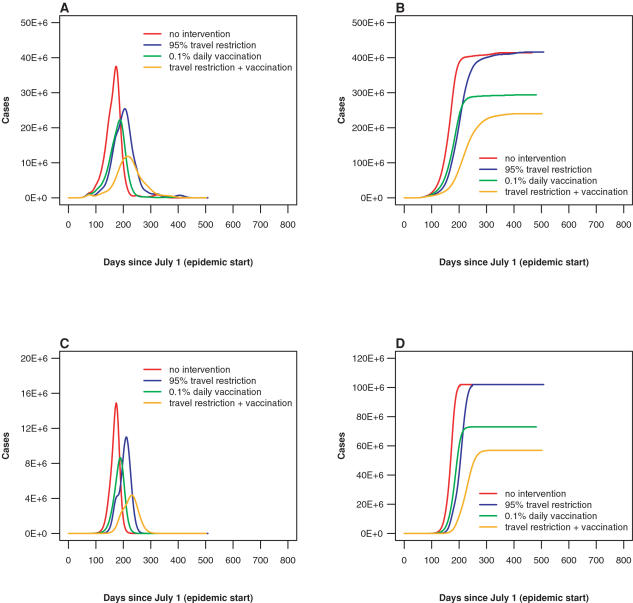
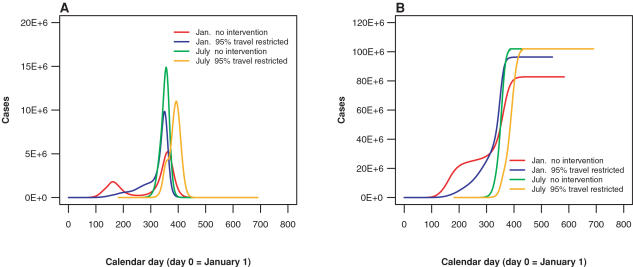
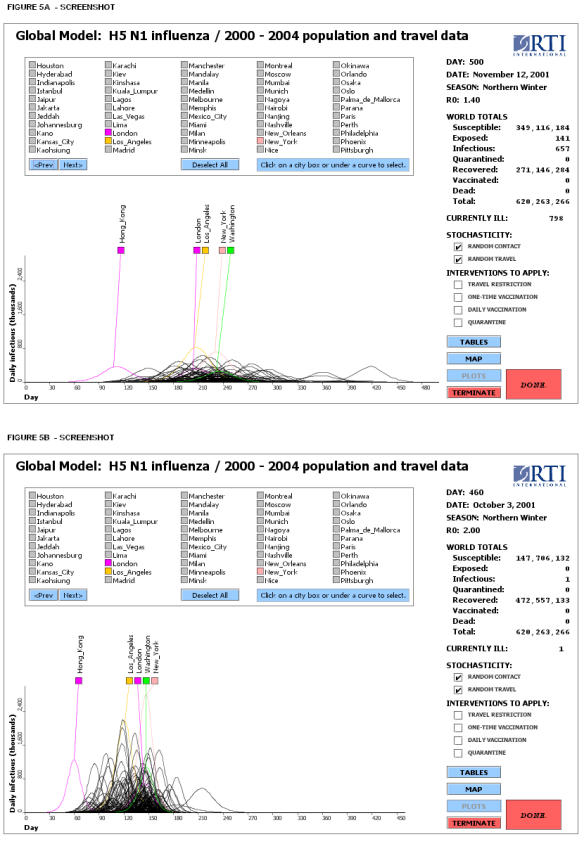
Methods and findings: A stochastic, equation-based epidemic model is used to study global transmission of pandemic flu, including the effects of travel restrictions and vaccination. Economic costs of intervention are also considered. The distribution of First Passage Times (FPT) to the United States and the numbers of infected persons in metropolitan areas worldwide are studied assuming various times and locations of the initial outbreak. International air travel restrictions alone provide a small delay in FPT to the U.S. When other containment measures are applied at the source in conjunction with travel restrictions, delays could be much longer. If in addition, control measures are instituted worldwide, there is a significant reduction in cases worldwide and specifically in the U.S. However, if travel restrictions are not combined with other measures, local epidemic severity may increase, because restriction-induced delays can push local outbreaks into high epidemic season. The per annum cost to the U.S. economy of international and major domestic air passenger travel restrictions is minimal: on the order of 0.8% of Gross National Product.

Conclusions: International air travel restrictions may provide a small but important delay in the spread of a pandemic, especially if other disease control measures are implemented during the afforded time. However, if other measures are not instituted, delays may worsen regional epidemics by pushing the outbreak into high epidemic season. This important interaction between policy and seasonality is only evident with a global-scale model. Since the benefit of travel restrictions can be substantial while their costs are minimal, dismissal of travel restrictions as an aid in dealing with a global pandemic seems premature.


Conflict of interest statement

Competing Interests: The authors have declared that no competing interests exist.

Figures

Figure 1
Figure 1. Epidemic severity vs. R0 value.
The severity and the speed of an epidemic both increase as the value of R0 increases. Results are shown for an epidemic starting in Hong Kong on July 1. The actual values of R0 are modified by seasonal and geographical factors. (A) Worldwide daily number of infected individuals. (B) Worldwide cumulative number of influenza cases. (C) U.S. daily number of infected individuals. (D) U.S. cumulative number of influenza cases. (green: R0 = 1.4, blue: R0 = 1.7, red: R0 = 2.0)
Figure 2
Figure 2. Effects of travel restrictions on epidemic severity.
High levels of international travel restrictions are necessary to reduce the total number of infected individuals worldwide. There is little difference in effect between sequential, city-by-city implementation of travel restrictions and simultaneous, worldwide implementation. Results are shown for an epidemic with R0 = 1.7 starting in Hong Kong on July 1. (blue: sequential travel restrictions; red: simultaneous travel restrictions, mean values shown, error bars = 95% confidence intervals)
Figure 3
Figure 3. Epidemic severity vs. intervention policy.
The speed and severity of an epidemic can be reduced by implementation of travel restriction and vaccination policies. Implementing both travel restrictions and vaccination can have a greater effect than implementing either policy alone. Results are shown for an epidemic with R0 = 1.7 starting in Hong Kong on July 1. (A) Worldwide daily number of infected individuals. (B) Worldwide cumulative number of influenza cases. (C) U.S. daily number of infected individuals. (D) U.S. cumulative number of influenza cases. (red: no intervention, blue: sequential 95% restriction of international travel, green: daily vaccination of 0.1% of susceptible population, orange: both travel restriction and vaccination)
Figure 4
Figure 4. Interaction between disease seasonality and travel restriction.
The timing of an outbreak can greatly influence the effects of international travel restrictions on the severity of the epidemic in a region such as the United States. Results are shown for epidemics with R0 = 1.7 beginning in Hong Kong on either January 1 or July 1. For an epidemic beginning in January, the initial epidemic wave in the United States is suppressed, although without other interventions, the second epidemic wave would be more severe. It is thus important to implement additional measures during the time gained. For an epidemic beginning in July, the delay in the epidemic is much smaller, but the overall severity is reduced. (A) U.S. daily number of infected individuals. (B) U.S. cumulative number of influenza cases. (red: January 1 epidemic start in Hong Kong with no intervention, blue: January 1 start in Hong Kong with sequential 95% restriction of international travel, green: July 1 epidemic start in Hong Kong with no intervention, orange: July 1 start in Hong Kong with sequential 95% restriction of international travel)
Figure 5
Figure 5. Potential synchronization of local epidemics depending on the rate of disease transmission.
Screenshots showing that with higher values of R0, individual cities' epidemic peaks are more clustered in time and the number of infected persons is much higher. (A) Time series diagram for major metropolitan areas for an uncontrolled influenza epidemic with R0 = 1.4. (B) Time series diagram for an epidemic with R0 = 2.0.

Similar articles

Cited by

References

    1. Rvachev LA, Longini IM., Jr A mathematical model for the global spread of influenza. Math Biosci. 1985;75:3–22.
    1. Grais RF, Ellis JH, Glass GE. Assessing the impact of airline travel on the geographic spread of pandemic influenza. Eur J Epidemiol. 2003;18:1065–1072. - PubMed
    1. Grais RF, Ellis JH, Kress A, Glass GE. Modeling the spread of annual influenza epidemics in the U.S.: The potential role of air travel. Health Care Manag Sci. 2004;7:127–134. - PubMed
    1. Cooper BS, Pitman RJ, Edmunds WJ, Gay NJ. Delaying the international spread of pandemic influenza. PLoS Med. 2006;3(6):e212. doi:10.1371/journal.pmed.0030212. - PMC - PubMed
    1. Colizza V, Barrat A, Barthelemy M, Valleron AJ, Vespignani A. Modeling the worldwide spread of pandemic influenza: Baseline case and containment interventions. PLoS Med. 2007;4(1):e13. doi:10.1371/journal.pmed.0040013. - PMC - PubMed

Publication types