. 2007 May 2;2(5):e410.
doi: 10.1371/journal.pone.0000410.

Negative BOLD fMRI response in the visual cortex carries precise stimulus-specific information

Affiliations

Negative BOLD fMRI response in the visual cortex carries precise stimulus-specific information

David Bressler et al. PLoS One. .

Abstract

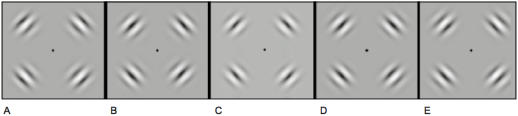
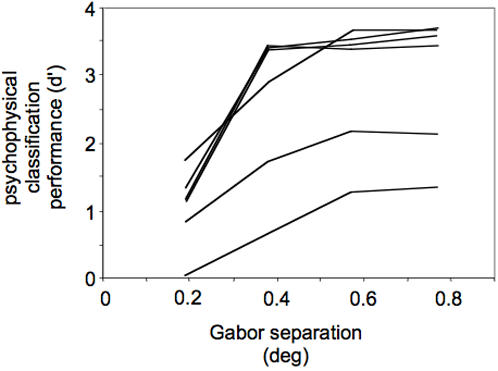
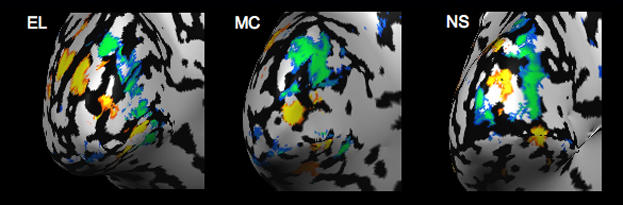
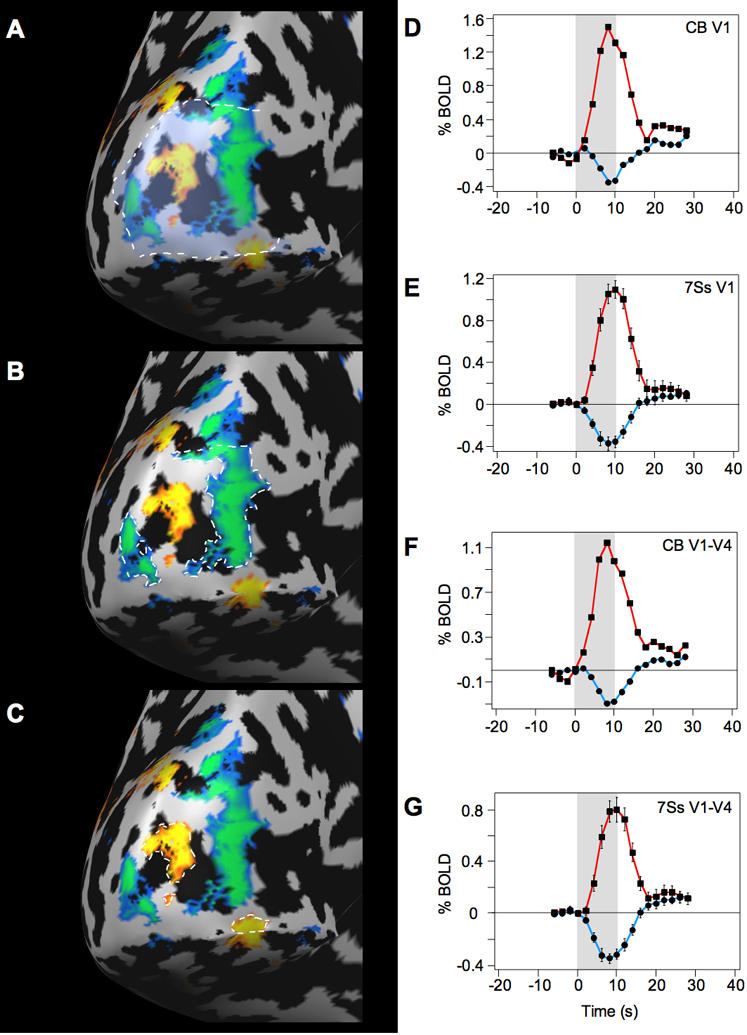
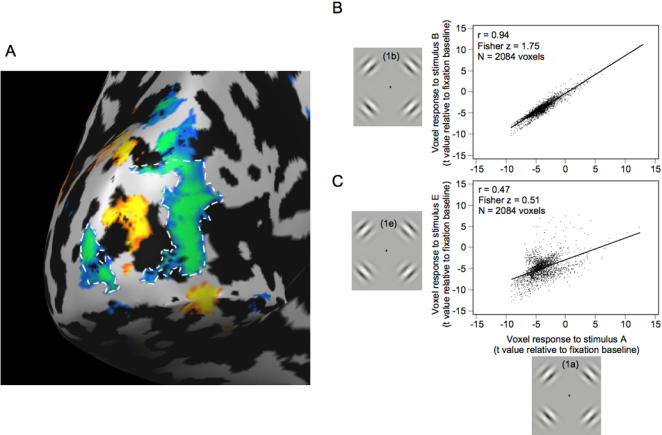
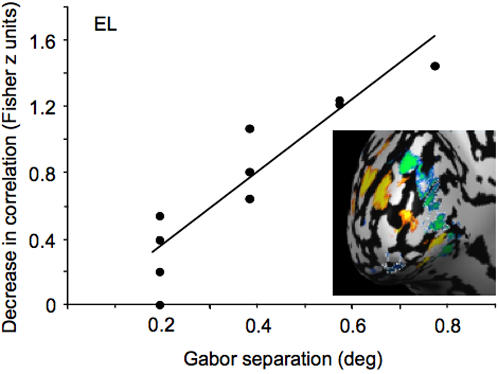
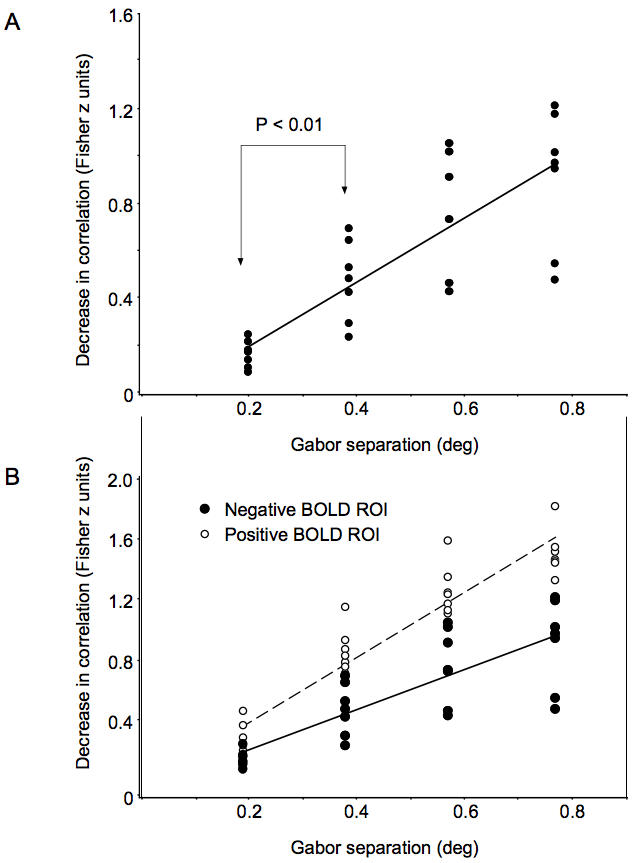
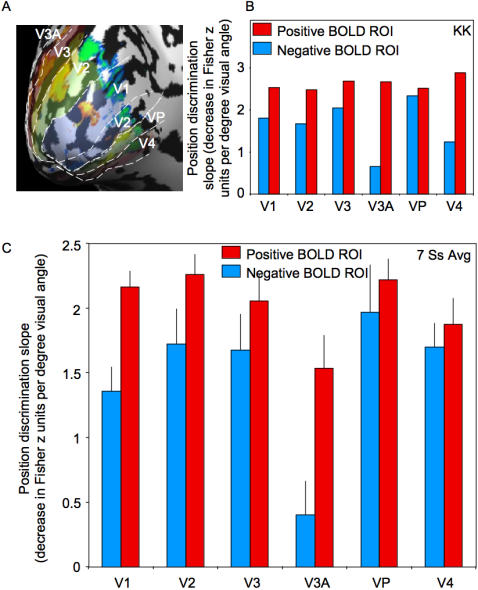
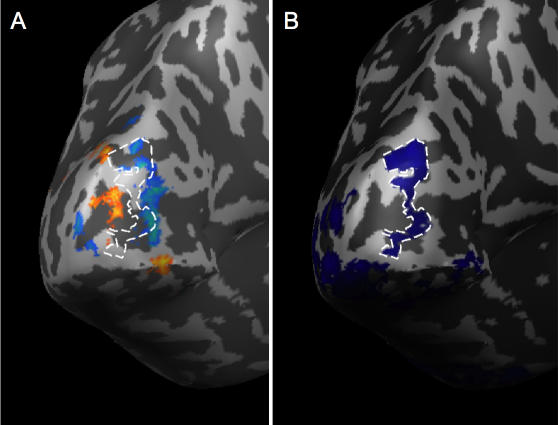
Sustained positive BOLD (blood oxygen level-dependent) activity is employed extensively in functional magnetic resonance imaging (fMRI) studies as evidence for task or stimulus-specific neural responses. However, the presence of sustained negative BOLD activity (i.e., sustained responses that are lower than the fixation baseline) has remained more difficult to interpret. Some studies suggest that it results from local "blood stealing" wherein blood is diverted to neurally active regions without a concomitant change of neural activity in the negative BOLD regions. However, other evidence suggests that negative BOLD is a result of local neural suppression. In both cases, regions of negative BOLD response are usually interpreted as carrying relatively little, if any, stimulus-specific information (hence the predominant reliance on positive BOLD activity in fMRI). Here we show that the negative BOLD response resulting from visual stimulation can carry high information content that is stimulus-specific. Using a general linear model (GLM), we contrasted standard flickering stimuli to a fixation baseline and found regions of the visual cortex that displayed a sustained negative BOLD response, consistent with several previous studies. Within these negative BOLD regions, we compared patterns of fMRI activity generated by flickering Gabors that were systematically shifted in position. As the Gabors were shifted further from each other, the correlation in the spatial pattern of activity across a population of voxels (such as the population of V1 voxels that displayed a negative BOLD response) decreased significantly. Despite the fact that the BOLD signal was significantly negative (lower than fixation baseline), these regions were able to discriminate objects separated by less than 0.5 deg (at approximately 10 deg eccentricity). The results suggest that meaningful, stimulus-specific processing occurs even in regions that display a strong negative BOLD response.


Conflict of interest statement

Competing Interests: The authors have declared that no competing interests exist.

Figures

Figure 1
Figure 1. Stimuli used in the experiment.
A–E. Four flickering Gabors were presented at one of five eccentricities; the standard deviation of each Gabor's contrast envelope was incrementally skewed by ∼0.19 deg toward (A–B) or away (D–E) from the fovea. The Gabors in (E) are skewed away from the Gabors in (A) by 0.77 deg (see Materials and Methods).
Figure 2
Figure 2. Psychophysical results for six subjects.
While in the scanner, subjects reported which condition they were viewing on each trial (5AFC classification task). The abscissa on the graph shows the difference in the eccentricity between any two of the five conditions (e.g., the difference in skew between Fig. 1A and 1B was 0.19 deg, while the difference between Fig. 1A and 1E was 0.77 deg). The ordinate shows discrimination (d-prime, calculated from the 5AFC classification data [54]). When two stimulus conditions were similar (e.g., Fig. 1A and 1B), subjects had difficulty classifying which condition they were viewing, resulting in a lower d-prime. Conditions that were separated by greater eccentricities yielded higher discrimination ability. For all subjects, discrimination improved with an increasing difference in the skew of the envelope. Overall ability varied between subjects, but the trend was consistent across subjects, and was significant for each subject (least significant log fit to the data was for subject MC, F(1,18) = 9.67, P<0.01).
Figure 3
Figure 3. Cortical surface maps for three representative subjects showing regions of positive (yellow-red) and negative (blue-green) BOLD activity.
The maps were generated by fitting a general linear model to the data and contrasting all of the flickering Gabor stimuli (Fig. 1) to a fixation baseline; the threshold for these maps was set at t = 5.6, P(Bonf)<0.001.
Figure 4
Figure 4. Surface map for representative subject and time course of BOLD response for all subjects.
A. Cortical surface for one subject showing visual area V1 (outlined), measured in separate retinotopic mapping runs (see Materials and Methods). B. Negative BOLD ROI in V1 for the representative subject. C. Positive BOLD ROI in V1 for the representative subject. D–E. Event-related average timecourses were measured separately for positive and negative BOLD ROIs. Positive BOLD ROI (red line, squares) and the negative BOLD ROI (blue line, circles) for a representative subject (D) and for the group of subjects (E). F–G. Positive and negative BOLD ROI responses averaged across visual areas V1, V2, V3, V3A, VP, and V4 for one representative subject (F), and for the group of subjects (G). The gray filled region in each graph shows the stimulus presentation (10 s). Error bars, ±s.e.m.
Figure 5
Figure 5. Measuring position discrimination in the visual cortex.
A. A representative subject's negative BOLD ROI (circled with dashed white line), composed of 2084 voxels. B. The response of each of the 2084 voxels in the negative BOLD ROI is plotted for two of the conditions (Fig. 1A and 1B). The abscissa shows the response to the stimulus in Fig. 1A (t score generated by a general linear model contrast relative to fixation baseline, see Materials and Methods). The ordinate shows the response to the stimulus in Fig. 1B. Across the population of voxels, there was a strong correlation in the responses to the two stimuli (r = 0.94, P<0.001). This is not surprising, given how similar the two conditions were. C. Within the same ROI, the response to the stimulus in Fig. 1A was compared to the response to the stimulus in Fig. 1E (a condition in which the Gabors were positionally skewed by 0.77 deg). Across the population of 2084 voxels, the correlation was r = 0.47. There was a significantly stronger correlation in (B) than in (C) (Fisher z difference = 1.75−0.51 = 1.24, Z = 44.2, P<0.001). That is, the Gabors that were close to each other produced a higher correlation than the Gabors that were separated by a greater distance.
Figure 6
Figure 6. Position discrimination within the negative BOLD ROI of one representative subject's visual area V1.
Within the negative BOLD ROI (circled in white dashed line), the pattern of responses to each of the five stimulus conditions (Fig. 1) were cross-correlated (the analysis from Fig. 5 was repeated for every pair of stimulus conditions). All correlations were converted to Fisher z scores and normalized to (subtracted from) the highest correlation (ordinate). Zero on the ordinate therefore indicates a high spatial correlation. The abscissa shows the difference in the eccentricity of any pair of conditions (ranging from 0.19 deg to 0.77 deg, as in Fig. 1). The graph indicates that as the eccentricity of the Gabor conditions is increasingly separated, the correlation across the spatial pattern of activity decreased (indicated by a positive slope in the data). A linear regression revealed a significant effect of Gabor separation on the spatial correlation (f(x) = 2.2x−0.08; F(1,8) = 43.6, P<0.001).
Figure 7
Figure 7. Position discrimination in V1.
A. Position discrimination in the negative BOLD ROI across all seven subjects. A linear regression revealed a significantly positive position discrimination slope (slope of 1.34; F(1,26) = 52.9, p<0.01). B. Within each subject's V1, the same analysis was applied to the positive BOLD ROIs (open circles). The slope of the position discrimination function in the positive BOLD ROI in V1 was 2.15 (F(1,26) = 202.1, P<0.001). Although the regions that display a positive BOLD response are better able to discriminate object position (F(1,6) = 49.3, P<0.01), the regions that display a negative BOLD response are still able to discriminate object position with remarkable precision.
Figure 8
Figure 8. Position discrimination across visual areas V1, V2, V3, V3A, VP, and V4.
A. Representative cortical surface map for one subject. B. The position discrimination slope for the negative (blue) and positive (red) BOLD ROIs within each visual area for the representative subject shown in (A). The position discrimination slope for each ROI was calculated as in Fig. 6. C. The position discrimination slope averaged across all seven subjects. For the positive BOLD ROIs (red bars), there was a significantly positive position discrimination slope across visual areas V1 through V4, indicating that all of these visual areas are topographically precise (i.e., they can detect 0.19 deg shifts in the position of an object at 9 deg eccentricity). The same was true for the negative BOLD ROIs as well. Of all the areas tested here, the least significant position discrimination was in the negative BOLD ROI in V3A (t(5) = 3.2, P<0.05). Error bars, ±1 s.e.m.
Figure 9
Figure 9. Regions of the visual cortex that were most sensitive to stimulus position.
A. The positive (red-orange) and negative (green-blue) BOLD response to the flickering Gabors for a representative subject. B. Position discrimination slopes (as in Fig. 7) were measured for every possible 5 mm3 ROI in the occipital lobe (see Materials and methods). Those overlapping ROIs that showed the steepest position discrimination slopes are shown in dark blue and outlined with a dashed white line. Notice that the region of the visual cortex that is most sensitive to stimulus position (within the white dashed line) falls between the positive and negative BOLD regions in (A). This supports the idea that the edges of the object representation, where the BOLD response changes from positive to negative, are especially important for object localization , .

References

    1. Logothetis NK, Pauls J, Augath M, Trinath T, Oeltermann A. Neurophysiological investigation of the basis of the fMRI signal. Nature. 2001;412:150–157. - PubMed
    1. Ogawa S, Lee TM, Stepnoski R, Chen W, Zhu XH, et al. An approach to probe some neural systems interaction by functional MRI at neural time scale down to milliseconds. Proc Natl Acad Sci U S A. 2000;97:11026–11031. - PMC - PubMed
    1. Raichle ME, MacLeod AM, Snyder AZ, Powers WJ, Gusnard DA, et al. A default mode of brain function. Proc Natl Acad Sci U S A. 2001;98:676–682. - PMC - PubMed
    1. Shulman GL. Common Blood Flow Changes across Visual Tasks: II. Decreases in Cerebral Cortex. Journal of Cognitive Neuroscience. 1997;9:648–663. - PubMed
    1. Smith AT, Singh KD, Greenlee MW. Attentional suppression of activity in the human visual cortex. Neuroreport. 2000;11:271–277. - PubMed

Publication types