

How generation intervals shape the relationship between growth rates and reproductive numbers
- PMID: 17476782
- PMCID: PMC1766383
- DOI: 10.1098/rspb.2006.3754
How generation intervals shape the relationship between growth rates and reproductive numbers
Abstract
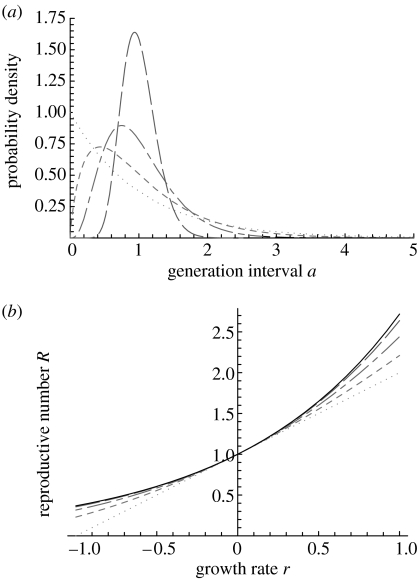
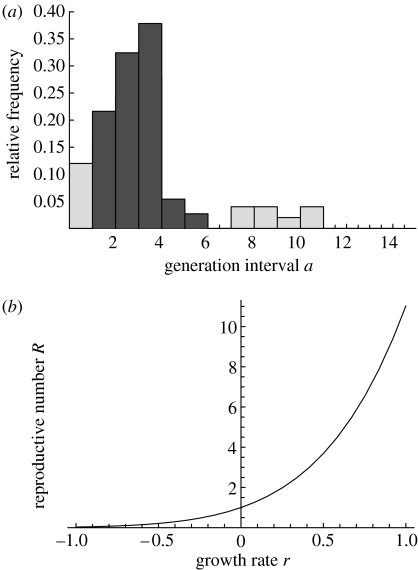
Mathematical models of transmission have become invaluable management tools in planning for the control of emerging infectious diseases. A key variable in such models is the reproductive number R. For new emerging infectious diseases, the value of the reproductive number can only be inferred indirectly from the observed exponential epidemic growth rate r. Such inference is ambiguous as several different equations exist that relate the reproductive number to the growth rate, and it is unclear which of these equations might apply to a new infection. Here, we show that these different equations differ only with respect to their assumed shape of the generation interval distribution. Therefore, the shape of the generation interval distribution determines which equation is appropriate for inferring the reproductive number from the observed growth rate. We show that by assuming all generation intervals to be equal to the mean, we obtain an upper bound to the range of possible values that the reproductive number may attain for a given growth rate. Furthermore, we show that by taking the generation interval distribution equal to the observed distribution, it is possible to obtain an empirical estimate of the reproductive number.
Figures
References
-
- Anderson R.M, May R.M. Oxford University Press; Oxford, UK: 1991. Infectious diseases of humans: dynamics and control.
-
- Begon M, Harper J.L, Townsend C.R. Blackwell; Oxford, UK: 1996. Ecology.
-
- Caswell H. 2nd edn. Sinauer Press; Sunderland, MA: 2001. Matrix population models: construction, analysis, and interpretation.
-
- Dublin L.I, Lotka A.J. On the true rate of natural increase, as exemplified by the population of the United States, 1920. J. Am. Stat. Assoc. 1925;150:305–339. doi:10.2307/2965517 - DOI
-
- Feller W. On the integral equation of renewal theory. Ann. Math. Stat. 1941;12:243–267.
Publication types
MeSH terms
Grants and funding
LinkOut - more resources
Full Text Sources
Other Literature Sources
Medical