. 2007 May 3:4:40.
doi: 10.1186/1743-422X-4-40.

Genome-wide diversity and selective pressure in the human rhinovirus

Affiliations

Genome-wide diversity and selective pressure in the human rhinovirus

Amy L Kistler et al. Virol J. .

Abstract

Background: The human rhinoviruses (HRV) are one of the most common and diverse respiratory pathogens of humans. Over 100 distinct HRV serotypes are known, yet only 6 genomes are available. Due to the paucity of HRV genome sequence, little is known about the genetic diversity within HRV or the forces driving this diversity. Previous comparative genome sequence analyses indicate that recombination drives diversification in multiple genera of the picornavirus family, yet it remains unclear if this holds for HRV.

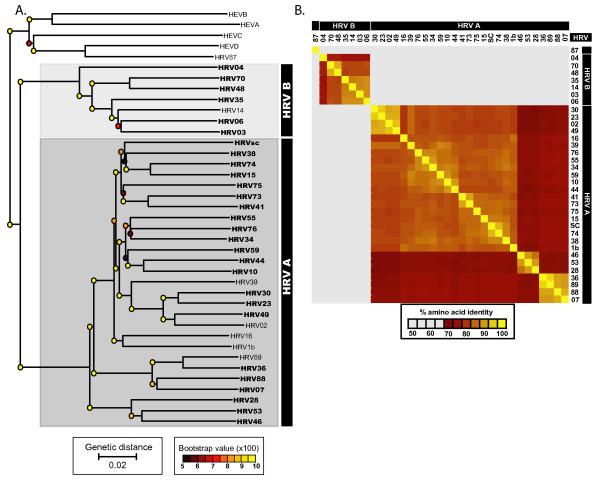
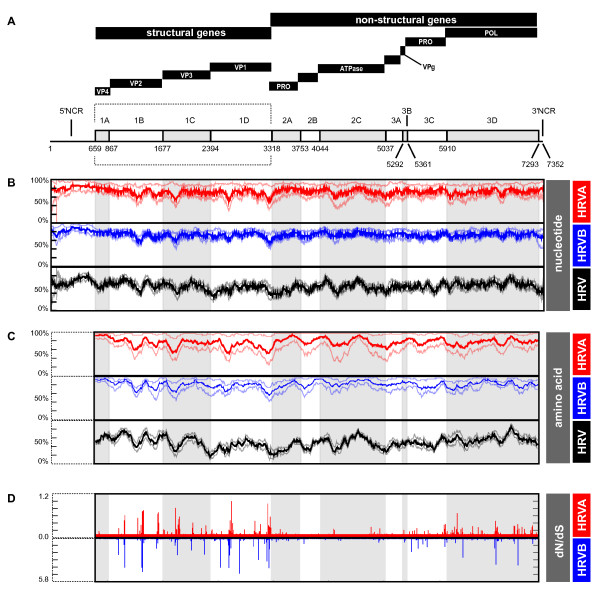
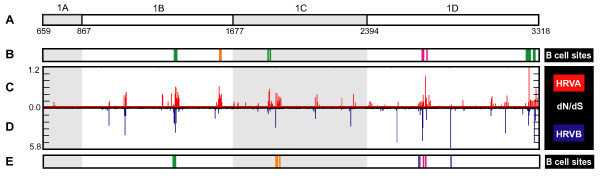
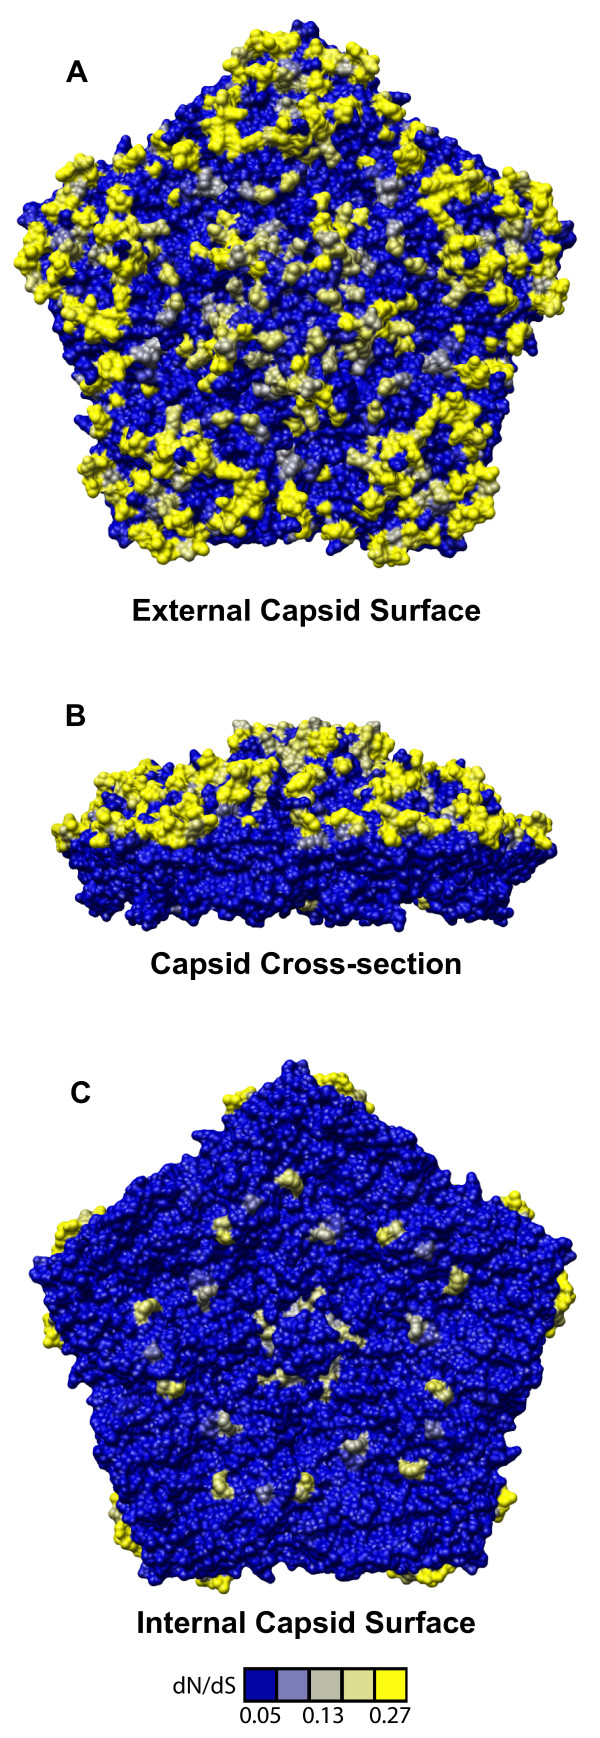
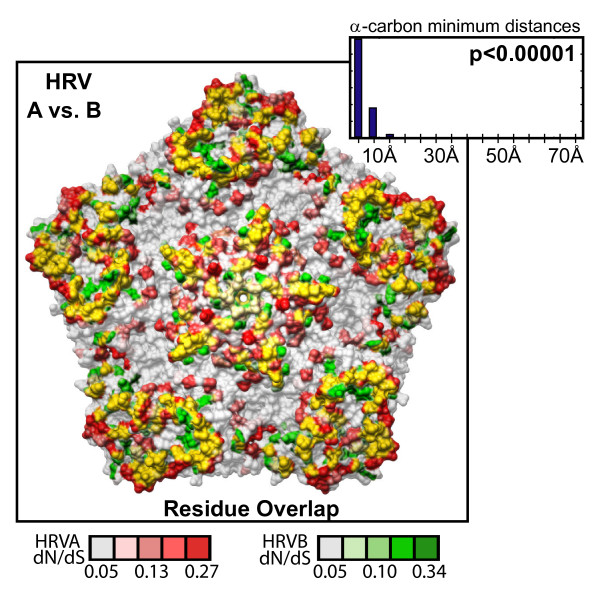
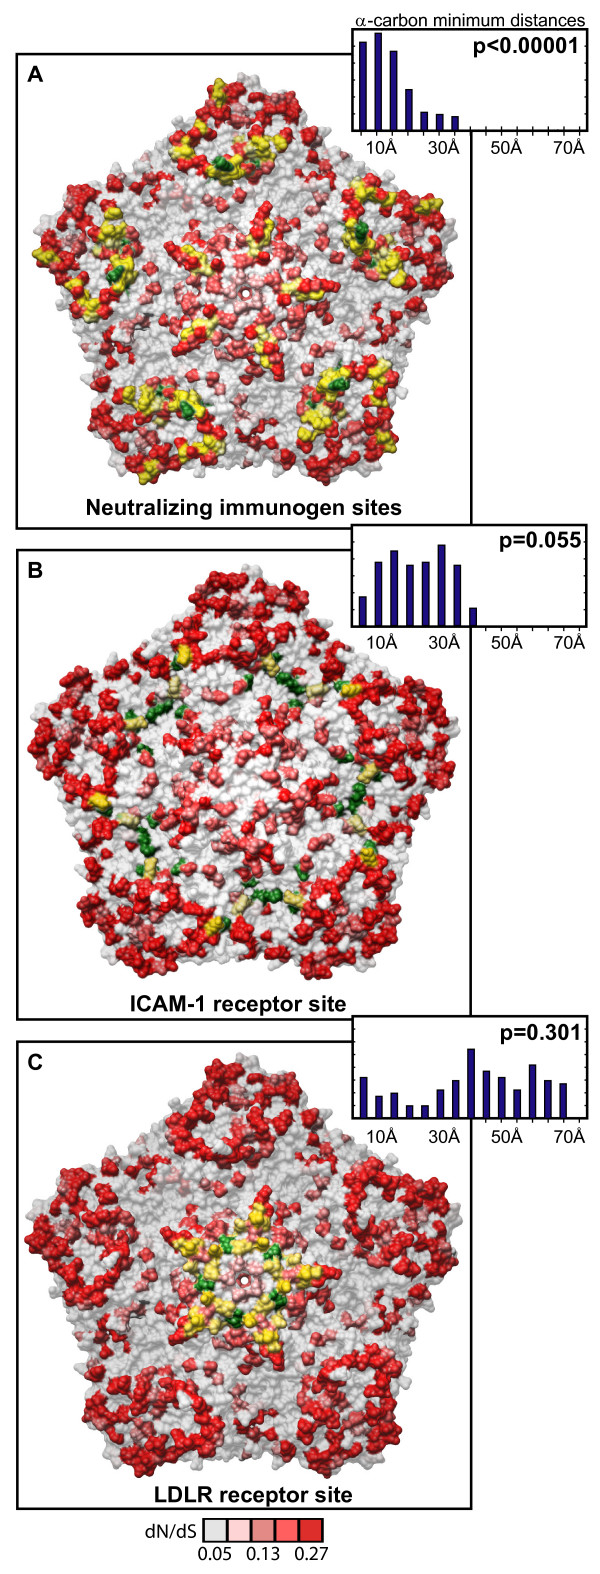
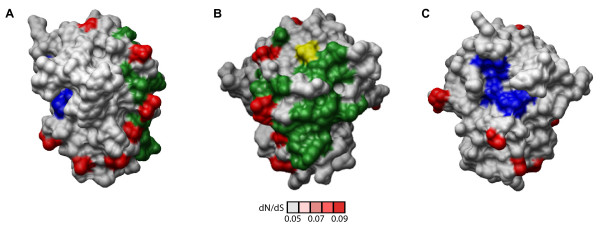
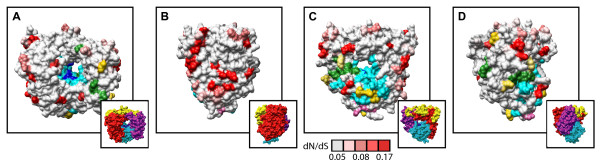
Results: To resolve this and gain insight into the forces driving diversification in HRV, we generated a representative set of 34 fully sequenced HRVs. Analysis of these genomes shows consistent phylogenies across the genome, conserved non-coding elements, and only limited recombination. However, spikes of genetic diversity at both the nucleotide and amino acid level are detectable within every locus of the genome. Despite this, the HRV genome as a whole is under purifying selective pressure, with islands of diversifying pressure in the VP1, VP2, and VP3 structural genes and two non-structural genes, the 3C protease and 3D polymerase. Mapping diversifying residues in these factors onto available 3-dimensional structures revealed the diversifying capsid residues partition to the external surface of the viral particle in statistically significant proximity to antigenic sites. Diversifying pressure in the pleconaril binding site is confined to a single residue known to confer drug resistance (VP1 191). In contrast, diversifying pressure in the non-structural genes is less clear, mapping both nearby and beyond characterized functional domains of these factors.

Conclusion: This work provides a foundation for understanding HRV genetic diversity and insight into the underlying biology driving evolution in HRV. It expands our knowledge of the genome sequence space that HRV reference serotypes occupy and how the pattern of genetic diversity across HRV genomes differs from other picornaviruses. It also reveals evidence of diversifying selective pressure in both structural genes known to interact with the host immune system and in domains of unassigned function in the non-structural 3C and 3D genes, raising the possibility that diversification of undiscovered functions in these essential factors may influence HRV fitness and evolution.


Figures

Figure 1
Figure 1
Genetic relationship among 35 diverse HRV genomes. A. Neighbor-joining phylogenetic tree based on whole genome nucleotide sequence of HRVs and representative HEV species. Dark gray box, HRV subgroup A genomes (27 genomes), pale gray box, HRV subgroup B genomes (7 genomes). Bold, HRV strains sequenced in this study (28 genomes); plain text, whole genome sequences for previously sequenced HRV genomes (NCBI accession numbers: HRV001b, 221708; HRV002, 61098; HRV014, 9626735; HRV016, 409463; HRV039, 53987041; HRV89, 9627730; HRV87/HEV68, 41019061) and HEV genome sequences (NCBI accession numbers: HEVA, NC_001612; HEVB, NC_001472; HEVC, NC_001428; HEVD, NC_001430). B. Whole genome pairwise amino acid identity matrix. Deduced amino acid sequences from the coding region of the 35 fully sequenced HRV genomes were compared in all possible pairwise combinations then clustered on both the X and Y-axis according to similarity in pairwise sequence identity profiles. HRV serotype is indicated by number on X and Y-axis flanking the matrix, HRVA and HRVB subgroup membership is shown in black bar above serotype identifiers.
Figure 2
Figure 2
Genetic diversity and selective pressure in the HRVA and HRVB genomes. A. HRV genome organization. Genome schematic depicting genes in coding regions (boxes) and the non-coding regions (lines). Black bars above genome schematic indicate classes of gene products and gene product identities, where known VP = viral protein; PRO = viral protease; ATPase = DEXH-box ATPase protein; VPg = viral protein genomic (highlighted by dotted box); POL = RNA dependent RNA polymerase; NCR = non-coding region; coordinates of gene boundaries derived from alignment of available HRV genome sequences; gray shading of every other gene is provided for orientation in lower panels. B. Pairwise nucleotide identity scans within and between HRVA and HRVB genomes in a window of 100 nucleotides, advanced in single nucleotide steps across the genome. C. Pairwise amino acid identity scans within and between HRVA and HRVB genomes in a window of 50 amino acids, advanced in single amino acid steps across the genome. D. Ratio of the number of non-synonymous to synonymous mutations (dN/dS) across the genome inferred from the sequences of the HRVA (red plot) and HRVB (blue plot) genomes. Maximal dN/dS for window size of 3 codons, advanced in single codon step, are plotted. For panels B and C, bold plots, correspond to average % pairwise sequence identity values; pale plots, minimum and maximum % pairwise sequence identity values.
Figure 3
Figure 3
Location of selective pressure and known immunogenic sites in capsid genes. A. Zoom-in on capsid region of genome (boxed region from Figure 2), schematized as described in Figure 2. B. Location of HRVA antigenic sites A (magenta), B (green), and C (orange) based on studies of HRV2 (Appleyard et al., 1990; Hastings et al., 1990; Speller et al., 1993; Hewat and Blaas, 1996; Hewat et al., 1998). C, D. Zoom-in on dN/dS plot for capsid genes of HRVA and HRVB, respectively. E. Location of HRVB antigenic sites NimIA (magenta), NimIB (violet), NimII (green) and NimIII (orange) based on studies of HRV14 (Sherry and Rueckert, 1985; Sherry et al., 1986).
Figure 4
Figure 4
Distribution of selective pressure on the HRV capsid pentamer subunit. Capsid pentamer subunit from the HRV16 viral particle crystal structure (Hadfield, et al., 1997) with residues shaded in yellow according to their corresponding dN/dS values (scale bar below panel C). A. External view. B. Cross-sectional (inside/outside) view. C. Internal face.
Figure 5
Figure 5
Comparison of selective pressure in HRVA and HRVB capsid genes. Overlay of diversifying selective pressure detected on the HRV capsid pentamer structure for HRVA (based on HRV2 capsid structure (Verdauger et al., 2000)) and HRVB (based on HRV14 capsid structure (Stanway et al., 1984)); HRVA and HRVB residues are shaded according to their corresponding dN/dS values as indicated below by the scale bar, with directly overlapping diversifying residues highlighted in yellow. Inset histogram, distribution of minimal distances between α-carbons of diversifying residues in HRV2 and HRV14; Y-axis is simple frequency count; p value provides frequency at which an average minimum distance similar to that for the observed distribution was detected when the locations of the diversifying residues were randomized on each pentamer surface, overlaid, and measured (n = 100,000 randomizations).
Figure 6
Figure 6
Distribution of diversifying capsid residues relative to functional domains. Diversifying residues in the HRV2 capsid pentamer (Verdauger et al., 2000) overlaid onto the characterized HRV antigenic sites (Appleyard et al., 1990; Hastings et al., 1990; Speller et al., 1993; Hewat and Blaas, 1996; Hewat et al., 1998). B. Diversifying residues in the HRV16 capsid pentamer (Hadfield, et al., 1997) overlaid onto the characterized ICAM1 cellular receptor contacts (Bella et al., 1999). C. Diversifying residues in the HRV2 capsid pentamer (Verdauger et al., 2000) overlaid onto the characterized LDLR cellular receptor contacts (Verdauger et al., 2004). Diversifying residues are shown in red, shaded according to corresponding dN/dS values as indicated by the scale bar below panel C; green, antigenic residues (A); ICAM1 receptor contacts (B), and LDLR contacts (C); yellow, diversifying residues that directly overlap functional residues. Inset histogram, distribution of minimal distances between α-carbons of diversifying residues and antigenic sites (A), ICAM1 contact residues (B), and LDLR contact residues (C); Y-axis is simple frequency count, with a range that varies for each panel; p values provide frequency at which an average minimum distance similar to that for the observed distribution was detected when the locations of the diversifying residues were randomized on each pentamer surface, and minimal distances to antigenic site residues (A), ICAM1R contact residues (B), and LDLR contact residues (C) were measured (n = 100,000 randomizations).
Figure 7
Figure 7
Location of diversifying residues and functional residues in the 3C protease. Three different views of diversifying residues in the HRV2 3C protease relative to protease active site residues (blue; (Matthews et al., 1999)) and residues implicated in RNA binding and VPg binding (green; (Matthews et al., 1999). A. Relative to both protease and RNA binding/VPg interacting domain. B. Relative to RNA binding/VPg interaction domain. C. Relative to the proteolytic active site (Matthews et al., 1999). Diversifying residues are shown in red, shaded according to their corresponding dN/dS values indicated by the scale bar; yellow, diversifying residues that directly overlap functional residues.
Figure 8
Figure 8
Location of diversifying residues and functional residues in the 3D polymerase. Front view (A), side view of fingers subdomain (B), back view (C), and side view of thumb subdomain (D) of the HRV14 3D polymerase structure (Love et al., 2004). Cyan, palm subdomain residues; blue, catalytic residues; green, residues implicated in VPg and CRE binding; pink, potential oligomerization interface I residues. Diversifying residues are shown in red, shaded according to their corresponding dN/dS values indicated by scale bar below panel C; yellow, diversifying residues that directly overlap functional residues. Insets A-D, provided for orientation to 3D polymerase subdomains: red, fingers subdomain; cyan, palm subdomain; purple, thumb subdomain; yellow, N-terminal residues.
Figure 9
Figure 9
Consensus structures and loop sequences for HRVA and HRVB minimal CREs. A. Consensus secondary structure and sequence of HRVA minimal CRE derived from alignment of publicly available HRV prototype sequences in the region of the 2A gene (Laine et al., 2005) identified to be the minimal functional CRE in HRV2 (Gerber et al., 2001). B. Consensus secondary structure and sequence of HRVB minimal CRE derived from an alignment of sequence from all HRVB prototypes in the region of the 1D gene (Ledford et al., 2004; Laine et al., 2005) shown to function as the minimal CRE in HRV14 (McKnight and Lemon, 1998; Yang et al., 2002). Circled residues, positions where compensatory substitutions are detected in the alignment. Gray residues indicate positions where substitutions that disrupt basepairing potential are detected in the alignment. Weblogo (Schneider and Stephens, 1990; Crook et al., 2004) of consensus sequence of loop region is provided above to provide a quantitative view of the conservation of this element. The height of each letter is proportional to the fraction of the observed frequency relative to the expected frequency at each position.

References

    1. Heikkinen T, Jarvinen A. The common cold. Lancet. 2003;361:51–59. doi: 10.1016/S0140-6736(03)12162-9. - DOI - PMC - PubMed
    1. Fendrick AM, Monto AS, Nightengale B, Sarnes M. The economic burden of non-influenza-related viral respiratory tract infection in the United States. Arch Intern Med. 2003;163:487–494. doi: 10.1001/archinte.163.4.487. - DOI - PubMed
    1. Gern JE, Galagan DM, Jarjour NN, Dick EC, Busse WW. Detection of rhinovirus RNA in lower airway cells during experimentally induced infection. Am J Respir Crit Care Med. 1997;155:1159–1161. - PubMed
    1. Papadopoulos NG, Bates PJ, Bardin PG, Papi A, Leir SH, Fraenkel DJ, Meyer J, Lackie PM, Sanderson G, Holgate ST, et al. Rhinoviruses infect the lower airways. J Infect Dis. 2000;181:1875–1884. doi: 10.1086/315513. - DOI - PubMed
    1. Papadopoulos NG, Johnston SL. Rhinoviruses as pathogens of the lower respiratory tract. Can Respir J. 2000;7:409–414. - PubMed

Publication types

Associated data