. 2007 May 4:7:42.
doi: 10.1186/1471-213X-7-42.

The zebrafish lysozyme C promoter drives myeloid-specific expression in transgenic fish

Affiliations

The zebrafish lysozyme C promoter drives myeloid-specific expression in transgenic fish

Chris Hall et al. BMC Dev Biol. .

Abstract

Background: How different immune cell compartments contribute to a successful immune response is central to fully understanding the mechanisms behind normal processes such as tissue repair and the pathology of inflammatory diseases. However, the ability to observe and characterize such interactions, in real-time, within a living vertebrate has proved elusive. Recently, the zebrafish has been exploited to model aspects of human disease and to study specific immune cell compartments using fluorescent reporter transgenic lines. A number of blood-specific lines have provided a means to exploit the exquisite optical clarity that this vertebrate system offers and provide a level of insight into dynamic inflammatory processes previously unavailable.

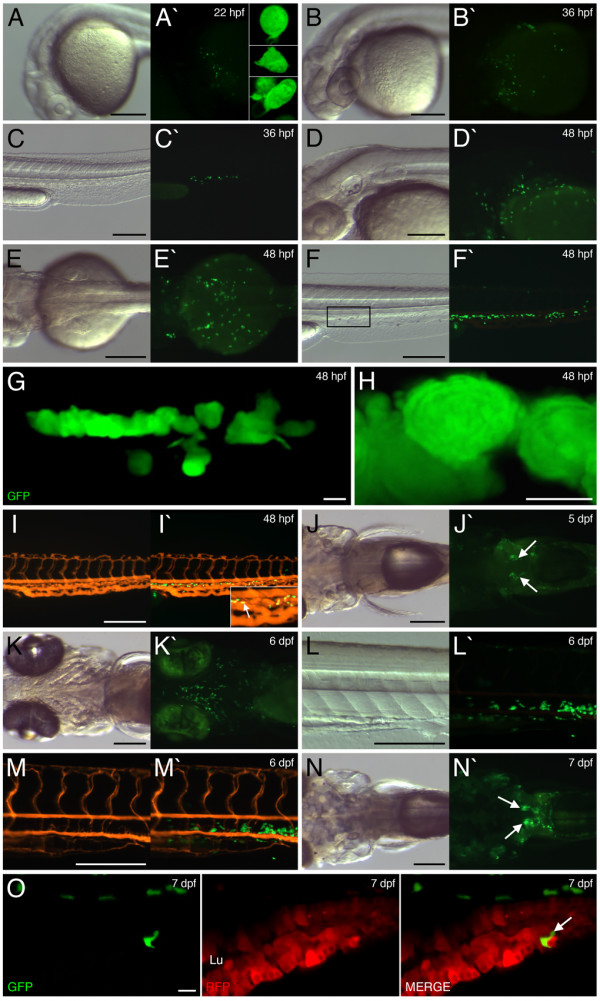
Results: We used regulatory regions of the zebrafish lysozyme C (lysC) gene to drive enhanced green fluorescent protein (EGFP) and DsRED2 expression in a manner that completely recapitulated the endogenous expression profile of lysC. Labeled cells were shown by co-expression studies and FACS analysis to represent a subset of macrophages and likely also granulocytes. Functional assays within transgenic larvae proved that these marked cells possess hallmark traits of myelomonocytic cells, including the ability to migrate to inflammatory sources and phagocytose bacteria.

Conclusion: These reporter lines will have utility in dissecting the genetic determinants of commitment to the myeloid lineage and in further defining how lysozyme-expressing cells participate during inflammation.


Figures

Figure 1
Figure 1
EGFP expression within lysC::EGFP transgenic embryos and larvae. EGFP expression within 22 hpf (A), 36 hpf (B and C), 48 hpf (D-I), 5 dpf (J), 6 dpf (K-M) and 7 dpf (N and O) transgenic embryos/larvae. (A, B and D) Lateral views of developing head, anterior to left. (C, F-I, L and M) Lateral views of trunk/tail region, anterior to left. (E, J and N) Dorsal view of cranio-trunk region, anterior to left. (K) Ventral view of head region, anterior to left. (A-N and A'-N') Bright field and dark field views, respectively. Insets in A' and I' represent magnified views of A' and I', respectively. (G) Summed Z stacks through aggregates of EGFP-labeled cells within posterior ICM region (marked by box in F). (H) Magnified view of cells in G. (I and M) Microangiography using red fluorescent microspheres within 48 hpf and 6 dpf transgenic larvae, respectively. (I' and M') Images merged with EGFP expression. Arrow in I' denotes EGFP-labeled cell within caudal vascular plexus. Arrows in J' and N' denote expression within the pronephric glomerulus. (O) Summed Z stacks through mid-intestine of 7 dpf lysC::EGFP/I-FABP::RFP compound transgenic larva (anterior to left). Abbreviations: Lu, gut lumen. Scale bars: 200 μm in A-F and I-N; 10 μm in G and O; 5 μm in H.
Figure 2
Figure 2
EGFP expression within adult lysC::EGFP transgenic animals. (A) Lateral view of pectoral fin region. (B) Lateral view of tail fin. (C) Ventral view of dissected head kidney. (D) Ventral view of dissected posterior kidney. Anterior to left in all views. (A-D and A'-D') Bright field and dark field views, respectively. Arrows mark EGFP-expressing cells within the lobes of the head kidney. Scale bars: 500 μm in A, C and D; 250 μm in B.
Figure 3
Figure 3
EGFP-expressing cells within adult kidney are myelomonocytic. (A) Flow cytometry of definitive hematopoietic compartment from adult lysC::EGFP animals by light-scatter characteristics. Percentages represent the relative contribution of the gated compartment. Cytospin preparations of GFP-sorted cells following Leishman's staining show clear myelomonocytic morphology. Analysis of GFP detection demonstrates that the labeled cell population is almost exclusive to the myelomonocytic compartment where 57.4 ± 3.5% (n = 4) of cells were GFP-positive. (B-D) Immunohistochemical detection of EGFP within adult lysC::EGFP sections. (B and C) Low and high magnification views, respectively, of EGFP-expressing cells (marked by large arrows) located within the head kidney occupying space between the renal tubules. (D) EGFP-expressing cell within the epidermal surface (marked by large arrow). Abbreviations: RT, renal tubule; S, scale. Scale bars: 50 μm in B-D.
Figure 4
Figure 4
EGFP-labeled cells co-express myeloid lineage markers. Dual immunohistological detection of EGFP and in situ hybridization detection of lysC (A and B), L-plastin (C and D) within 48 hpf and fms (E), mpo (F) within 32 hpf lysC::EGFP animals. (A/C/E/F and B/D) Summed Z stacks within posterior ICM compartment and within hindbrain, respectively, of transgenic animals. Arrow in C and E denotes EGFP-negative cell expressing L-plastin and fms, respectively. Arrow in F denotes EGFP-expressing cell that does not co-express mpo. Anterior to left in all images. Scale bars: 50 μm in A; 10 μm in B-F.
Figure 5
Figure 5
Labeled cells within transgenic larvae exhibit robust responses to acute inflammation. (A and B) Inflammation assay within 7 dpf lysC::EGFP larva imaged 5 min. and 6 hours post insult, respectively. Lateral views of transected tails, anterior to left. (A/B and A'/B') Bright field and dark field images, respectively. (C) Higher resolution analysis of inflammatory response within 6 dpf lysC::DsRED2/fli1::EGFP compound transgenic animals following wounding of the ventral fin. Time-lapse images every 15 minutes (starting 6 minutes following wounding) demonstrating progressive accumulation of marked cells at the injury site. White polygon demarcates injury boundaries. Scale bars: 200 μm in A and B.
Figure 6
Figure 6
lysozyme C-expressing cells demonstrate varied responses to induced inflammation. (A-C) Cell tracking of individual responses, upper image in A and C displays cells at ventral-most location during migration, lower images display return migration of the same cell towards the caudal vein, arrows denote trajectory. Upper image in B displays a cell revisiting the injury and then retuning to the vasculature (lower image). White polygon demarcates injury boundaries.
Figure 7
Figure 7
Labeled cells within transgenic larvae display phagocytic activity. Phagocytosis of red fluorescent microspheres by labeled cells within 4 dpf lysC::EGFP larvae. (A-C) Summed Z stacks through individual EGFP-labeled cells within 4 dpf transgenic larvae approximately 6 hours following injection of fluorescent microspheres. (D) Summed Z stacks through posterior intestine of DsRED2-expressing cells containing ingested GFP-labeled Salmonella following infection of lysC::DsRED2 larvae at 5 dpf (images captured at 8 dpf). Arrow denotes labeled cell containing GFP-labeled bacteria, arrowhead denotes a labeled cell actively phagocytosing a microcolony of GFP-expressing bacteria. Scale bars: 10 μm.

References

    1. Banchereau J, Steinman RM. Dendritic cells and the control of immunity. Nature. 1998;392:245–252. doi: 10.1038/32588. - DOI - PubMed
    1. Hoebe K, Janssen E, Beutler B. The interface between innate and adaptive immunity. Nat Immunol. 2004;5:971–974. doi: 10.1038/ni1004-971. - DOI - PubMed
    1. Dustin ML. Stop and go traffic to tune T cell responses. Immunity. 2004;21:305–314. doi: 10.1016/j.immuni.2004.08.016. - DOI - PubMed
    1. Germain RN, Miller MJ, Dustin ML, Nussenzweig MC. Dynamic imaging of the immune system: progress, pitfalls and promise. Nat Rev Immunol. 2006;6:497–507. doi: 10.1038/nri1884. - DOI - PubMed
    1. Amsterdam A, Hopkins N. Mutagenesis strategies in zebrafish for identifying genes involved in development and disease. Trends Genet. 2006;22:473–478. doi: 10.1016/j.tig.2006.06.011. - DOI - PubMed

Publication types

MeSH terms

LinkOut - more resources