

Dynamic causal modelling of evoked potentials: a reproducibility study
- PMID: 17478106
- PMCID: PMC2640482
- DOI: 10.1016/j.neuroimage.2007.03.014
Dynamic causal modelling of evoked potentials: a reproducibility study
Abstract
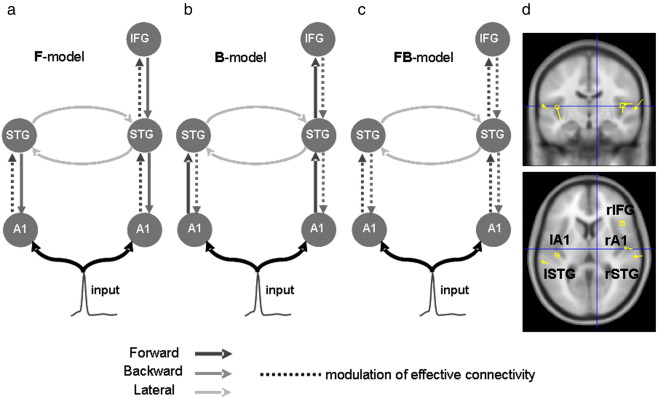
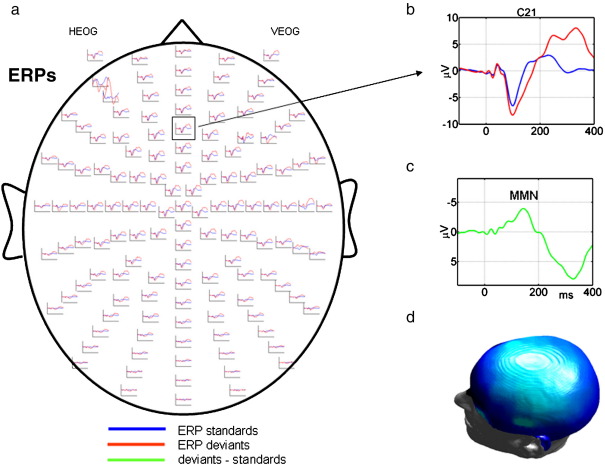
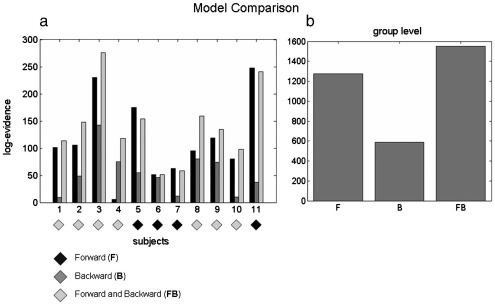
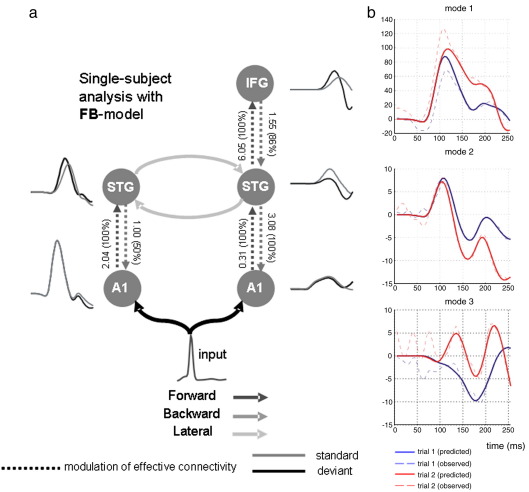
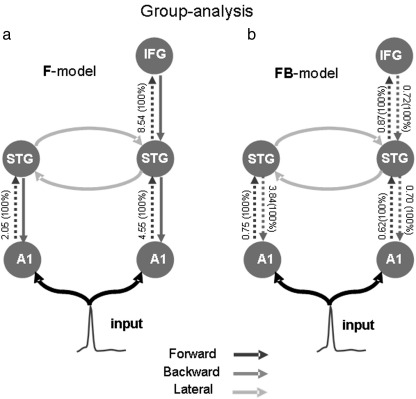
Dynamic causal modelling (DCM) has been applied recently to event-related responses (ERPs) measured with EEG/MEG. DCM attempts to explain ERPs using a network of interacting cortical sources and waveform differences in terms of coupling changes among sources. The aim of this work was to establish the validity of DCM by assessing its reproducibility across subjects. We used an oddball paradigm to elicit mismatch responses. Sources of cortical activity were modelled as equivalent current dipoles, using a biophysical informed spatiotemporal forward model that included connections among neuronal subpopulations in each source. Bayesian inversion provided estimates of changes in coupling among sources and the marginal likelihood of each model. By specifying different connectivity models we were able to evaluate three different hypotheses: differences in the ERPs to rare and frequent events are mediated by changes in forward connections (F-model), backward connections (B-model) or both (FB-model). The results were remarkably consistent over subjects. In all but one subject, the forward model was better than the backward model. This is an important result because these models have the same number of parameters (i.e., the complexity). Furthermore, the FB-model was significantly better than both, in 7 out of 11 subjects. This is another important result because it shows that a more complex model (that can fit the data more accurately) is not necessarily the most likely model. At the group level the FB-model supervened. We discuss these findings in terms of the validity and usefulness of DCM in characterising EEG/MEG data and its ability to model ERPs in a mechanistic fashion.
Figures
References
-
- David O., Friston K.J. A neural mass model for MEG/EEG: coupling and neuronal dynamics. NeuroImage. 2003;20:1743–1755. - PubMed
-
- David O., Harrison L., Friston K.J. Modelling event-related responses in the brain. NeuroImage. 2005;25:756–770. - PubMed
-
- David O., Kiebel S.J., Harrison L.M., Mattout J., Kilner J.M., Friston K.J. Dynamic causal modelling of evoked responses in EEG and MEG. NeuroImage. 2006;30:1255–1272. - PubMed
-
- Doeller C.F., Opitz B., Mecklinger A., Krick C., Reith W., Schröger E. Prefrontal cortex involvement in preattentive auditory deviance detection: neuroimaging and electrophysiological evidence. NeuroImage. 2003;20:1270–1282. - PubMed
Publication types
MeSH terms
Grants and funding
LinkOut - more resources
Full Text Sources
