. 2007;35(10):3478-93.
doi: 10.1093/nar/gkm249. Epub 2007 May 3.

Trypanosoma brucei homologous recombination is dependent on substrate length and homology, though displays a differential dependence on mismatch repair as substrate length decreases

Affiliations

Trypanosoma brucei homologous recombination is dependent on substrate length and homology, though displays a differential dependence on mismatch repair as substrate length decreases

Rebecca L Barnes et al. Nucleic Acids Res. 2007.

Abstract

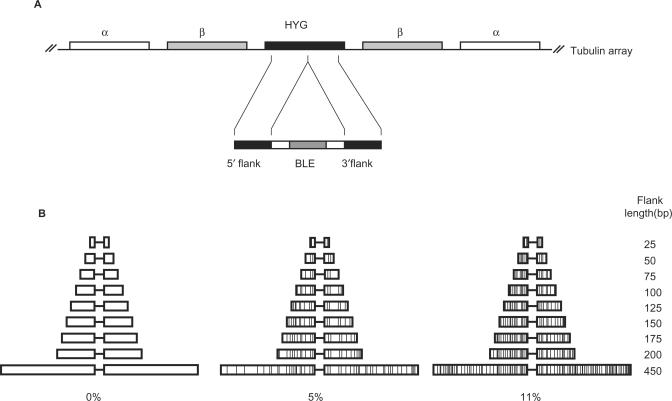
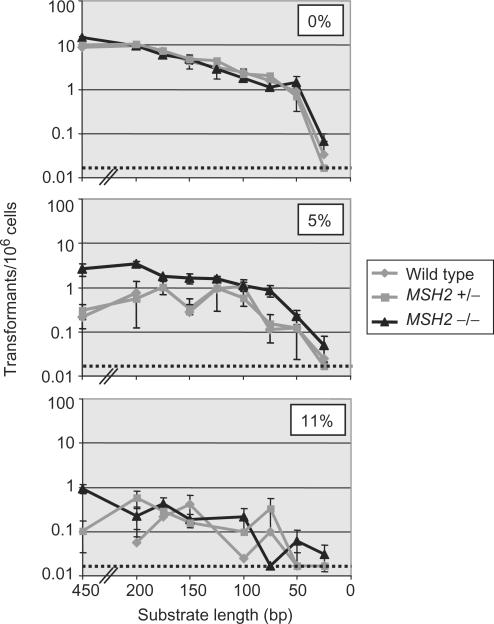
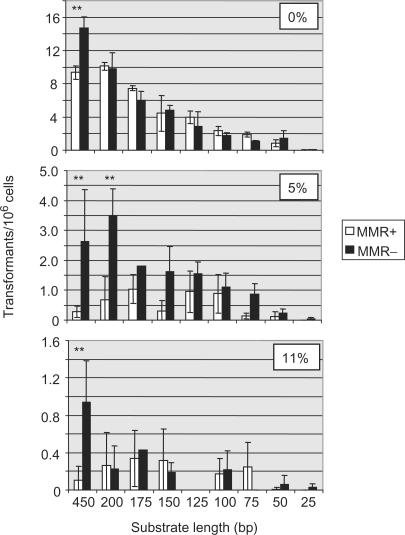
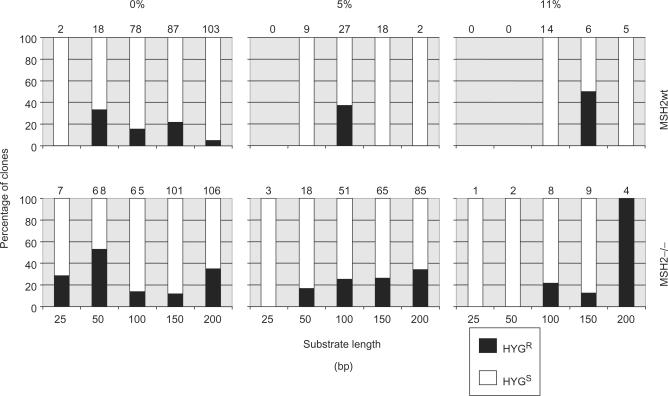
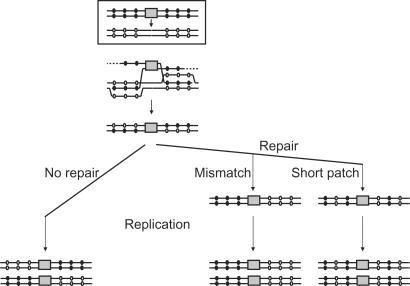
Homologous recombination functions universally in the maintenance of genome stability through the repair of DNA breaks and in ensuring the completion of replication. In some organisms, homologous recombination can perform more specific functions. One example of this is in antigenic variation, a widely conserved mechanism for the evasion of host immunity. Trypanosoma brucei, the causative agent of sleeping sickness in Africa, undergoes antigenic variation by periodic changes in its variant surface glycoprotein (VSG) coat. VSG switches involve the activation of VSG genes, from an enormous silent archive, by recombination into specialized expression sites. These reactions involve homologous recombination, though they are characterized by an unusually high rate of switching and by atypical substrate requirements. Here, we have examined the substrate parameters of T. brucei homologous recombination. We show, first, that the reaction is strictly dependent on substrate length and that it is impeded by base mismatches, features shared by homologous recombination in all organisms characterized. Second, we identify a pathway of homologous recombination that acts preferentially on short substrates and is impeded to a lesser extent by base mismatches and the mismatch repair machinery. Finally, we show that mismatches during T. brucei recombination may be repaired by short-patch mismatch repair.


Figures

Figure 1.
Figure 1.
Assaying the length and sequence homology requirements of T. brucei recombination. (A) HYG (black box), encoding hygromycin resistance, was integrated into the tubulin array of bloodstream stage T. brucei cells, replacing an α-tubulin ORF (white box). HYG-transformed cells were then transformed with constructs containing a bleomycin resistance gene (BLE; dark grey box) and recombination flanks which target integration to HYG. (B) The HYG recombination flanks of the different constructs used in this study are diagrammed. In each, the 5′ and 3′ flanks are shown as boxes of decreasing size, depicting the different lengths (indicated) of the homology with HYG. The constructs were of three classes: the flanks had 100% sequence homology with HYG (indicated as 0% divergence), or had base mismatches (depicted by vertical lines) that reduced the homology to 95% (5% divergence) or 89% (11% divergence).
Figure 2.
Figure 2.
Transformation rate relative to substrate length and sequence homology. Plotted values represent the mean transformation efficiency for wild type, MSH2 heterozygous (+/−) or MSH2 homozygous (−/−) bloodstream stage T. brucei cells derived from at least three separate experiments; the error bars show standard error and the dotted lines depict the lowest detectable transformation rate in this assay. The upper graph depicts the relationship between transformation and substrate length with constructs that are 100% sequence matched (0% divergence), while the middle and lower graphs show the effect of increasing substrate divergence to 5% (95% sequence homology) and 11% (89% homology), respectively.
Figure 3.
Figure 3.
A comparison of transformation efficiency in mismatch repair-proficient and -deficient T. brucei cells. The values in the bar charts depict the average transformation rates of constructs with decreasing lengths of targeting flanks; error bars show standard error. In each case, white bars show the transformation rate of MMR-proficient cells (MMR+; wild type and MSH2+/−) and grey bars depict MMR-deficient cells (MMR−; msh2−/−). The top graph shows transformation rates of constructs with 100% sequence homology (0% sequence divergence) with the genomic HYG target, while the middle graph shows constructs that have 95% homology (5% divergence) and the lower graph shows constructs with 89% homology (11% divergence). Asterisks indicate a statistically significant difference between the transformation rate in the MMR+ and MMR− cells (P < 0.05; two sample t-test).
Figure 4.
Figure 4.
Antibiotic resistance patterns of transformants generated in the recombination assay. The bar charts show the proportion of hygromycin resistant (HygR; black) and sensitive (HygS; white) transformant clones recovered in wild type (wt) or MSH2 homozygous (−/−) mutant T. brucei bloodstream stage cells following the transformation of constructs of varying substrate length and 0, 5 or 11% divergence from the genomic HYG sequence. Values above the charts indicate the number of transformants analysed.
Figure 5.
Figure 5.
Genomic analysis of hygromycin-resistant transformants in msh2−/− mutants. (A) A Southern blot of genomic DNA from MSH2 homozygous mutant transformant clones digested with HindIII and probed with the bleomycin resistance gene ORF (BLE). The same blot was then stripped and re-probed with a portion of the hygromycin-resistance gene ORF (HYG). Asterisks denote transformants in which the constructs have integrated aberrantly. The constructs that gave rise to each transformant are in the following lanes: 1–3, 0%–50 bp; 4–5, 0%–100 bp; 6–7, 0%–150 bp; 8–9, 0%–200 bp; 10, 5%–150 bp; 11, 5%–200 bp; 12–13, 11%–100 bp; 14, 11%–150 bp; 15, 0%–100 bp; 16–17, 0%–150 bp; 18–19, 5%–100 bp; 20–22, 5%–200 bp; 23, 11%–100 bp; 24, 11%–150 bp. (B) A depiction of the expected restriction map of the HYG locus before (upper diagram) and after (lower diagram) homologous integration of BLE. The positions of probe fragments and the expected size of HindIII fragments are indicated.
Figure 6.
Figure 6.
Pulse field gel electrophoretic analysis of transformants. Intact chromosomal DNA from untransformed cells (HTUBwt), and from 5 hygromycin resistant (HygR) and 3 hygromycin sensitive (HygS) transformants, is shown. Bands corresponding to the T. brucei megabase-sized chromosomes and to the intermediate-sized and mini-chromosomes (Ints/minis) are indicated. The arrow indicates the position of a novel, 370 kb molecule in the HygR5 transformant.
Figure 7.
Figure 7.
Mismatched base patterns in the DNA of integrated constructs. Circles denote the positions of bases that are mismatched between transformation constructs and the genomic HYG gene that is targeted by homologous recombination; filled circles denote that the sequence of a base matches the construct sequence, while open circles denote genomic HYG base sequence. The targeting flanks of the constructs are shown as lines, and the grey box indicates the central BLE resistance marker used for selection of transformants. Clone numbers for each DNA sequence are shown to the right, as well as the length of the flanks, the extent of sequence divergence relative to HYG, and whether the transformants were generated in wild type or msh2−/− T. brucei cells.
Figure 8.
Figure 8.
Linear regression analysis comparing the relationship between transformation rate and substrate length in T. brucei. Transformation rate was plotted for the combined wild type and MSH2+/− (MMR proficient; MMR+) data for the sequence-matched substrates (0% divergence) in Table 1 relative to substrate length. The coefficient of determination (R2) and the equations used to calculate the lines of best fit are indicated; only rates in the linear range (substrates from 200 to 50 bp) were included.
Figure 9.
Figure 9.
Gene targeting by two-end invasion. Grey boxes denote the BLE selectable marker. Lines indicate the flanks of the transformation construct or HYG target, within which black circles denote bases in the targeting construct that are mismatched with bases in HYG, which are shown in equivalent positions but as white circles. The boxed diagram denotes the route of targeted integration. Below is a model for integration showing how the 3′ single-strand ends of the construct invade HYG (dotted lines denote 5′-3′ nucleolytic degradation), and the result of resolution of the strand exchange intermediate. The pattern of mismatched bases in the integrated DNA is then shown following replication of the chromosome to yield two daughters, distinguishing the outcomes if no DNA repair of the mismatches occurs (left), or if mismatch repair precedes replication and occurs in favour of the lower DNA strand (middle), or if repair occurs by short-patch repair with an incomplete bias towards the lower strand (right).

Similar articles

Cited by

References

    1. Aravind L, Walker DR, Koonin EV. Conserved domains in DNA repair proteins and evolution of repair systems. Nucleic Acids Res. 1999;27:1223–1242. - PMC - PubMed
    1. Fujisawa H, Yonesaki T, Minagawa T. Sequence of the T4 recombination gene, uvsX, and its comparison with that of the recA gene of Escherichia coli. Nucleic Acids Res. 1985;13:7473–7481. - PMC - PubMed
    1. West SC. Molecular views of recombination proteins and their control. Nat. Rev. Mol. Cell Biol. 2003;4:435–445. - PubMed
    1. Story RM, Weber IT, Steitz TA. The structure of the E. coli recA protein monomer and polymer. Nature. 1992;355:318–325. - PubMed
    1. Conway AB, Lynch TW, Zhang Y, Fortin GS, Fung CW, Symington LS, Rice PA. Crystal structure of a Rad51 filament. Nat. Struct. Mol. Biol. 2004;11:791–796. - PubMed

Publication types