. 2007;35(10):3431-41.
doi: 10.1093/nar/gkm214. Epub 2007 May 3.

Transcription-coupled deposition of histone modifications during MHC class II gene activation

Affiliations

Transcription-coupled deposition of histone modifications during MHC class II gene activation

Natalia Rybtsova et al. Nucleic Acids Res. 2007.

Abstract

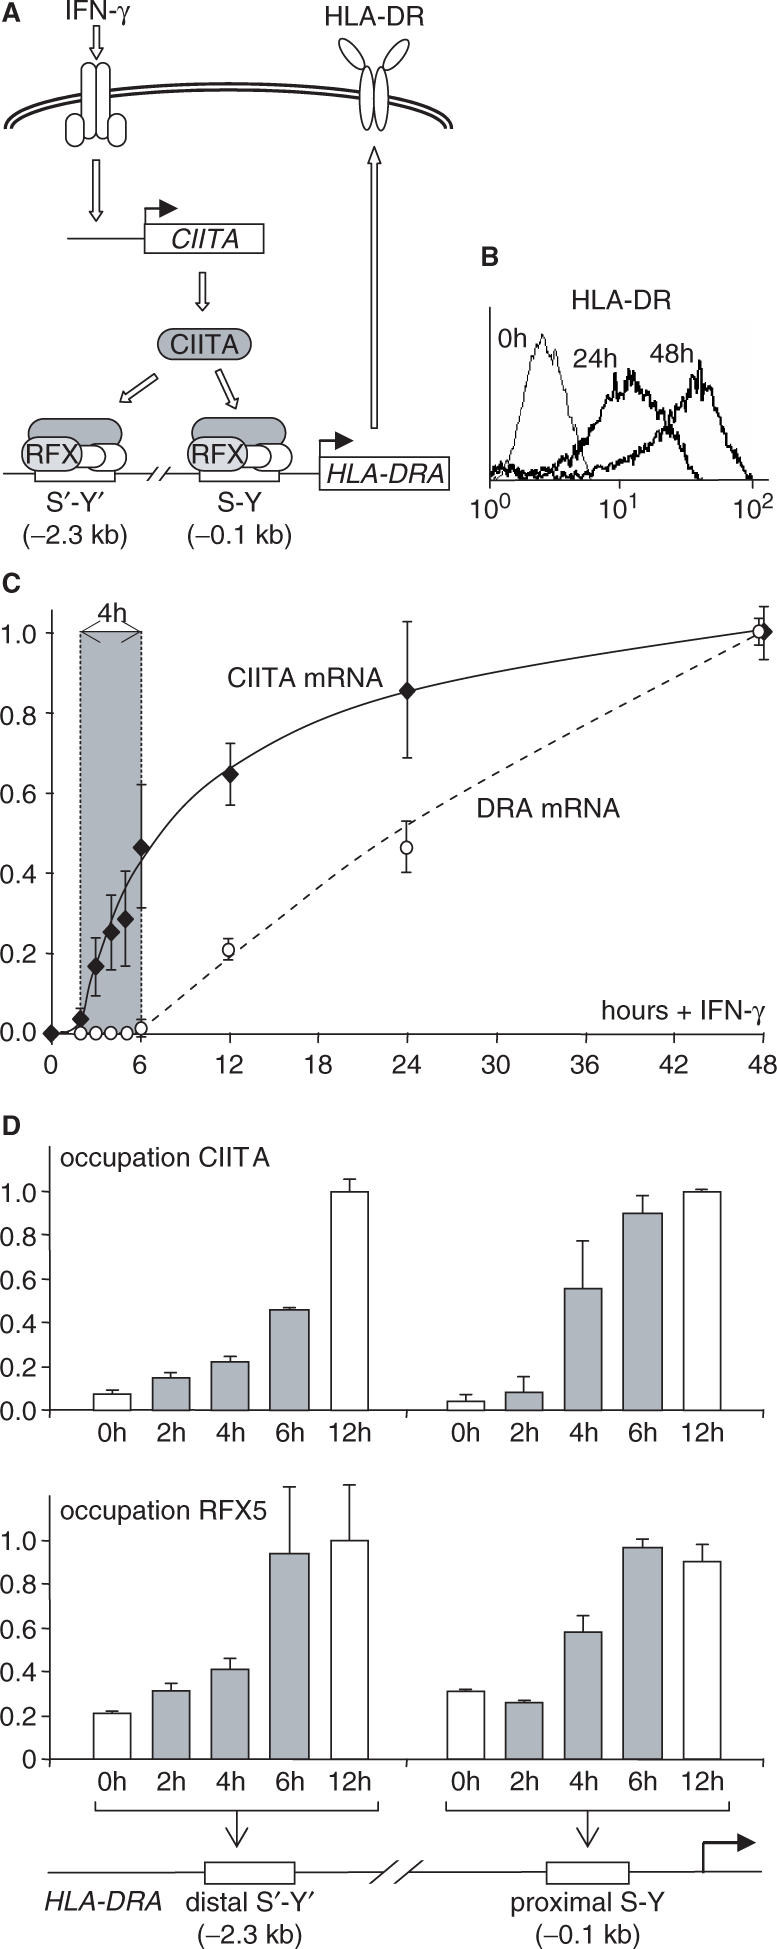
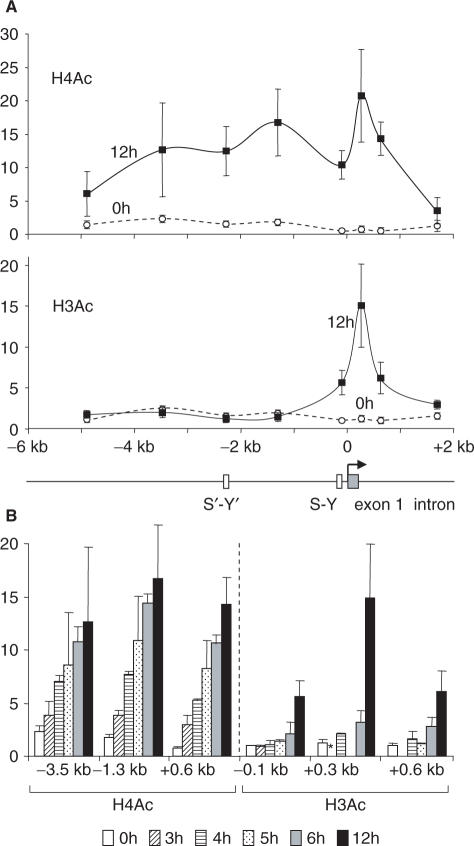
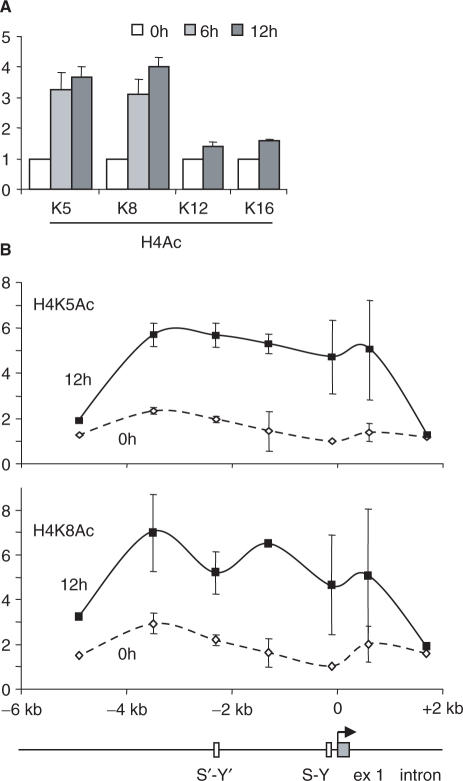
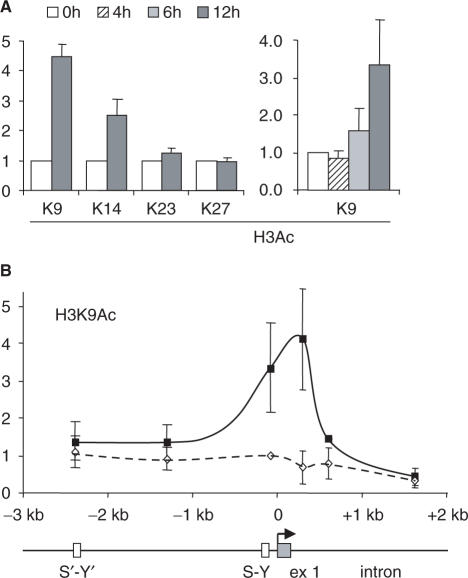
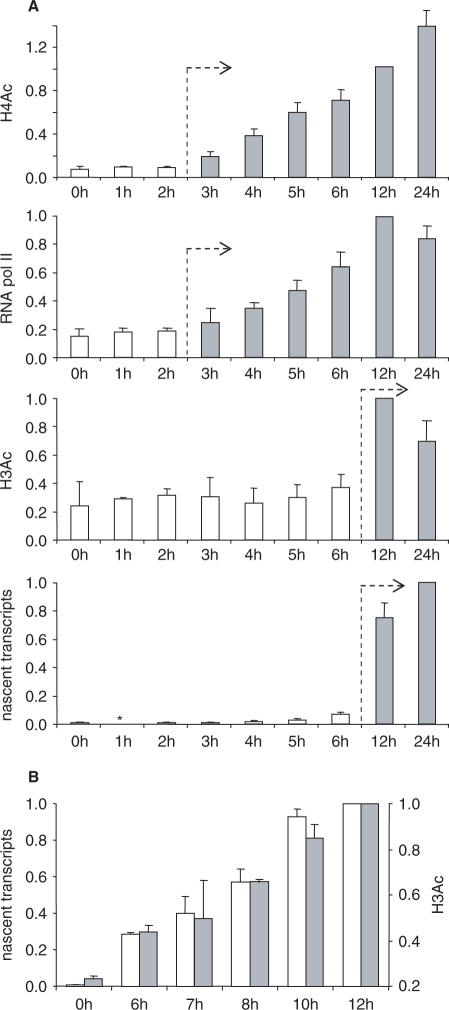
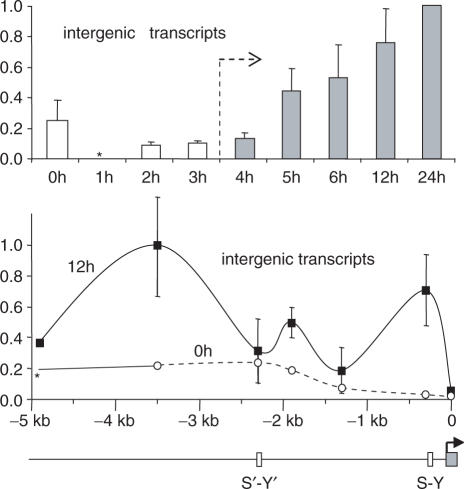
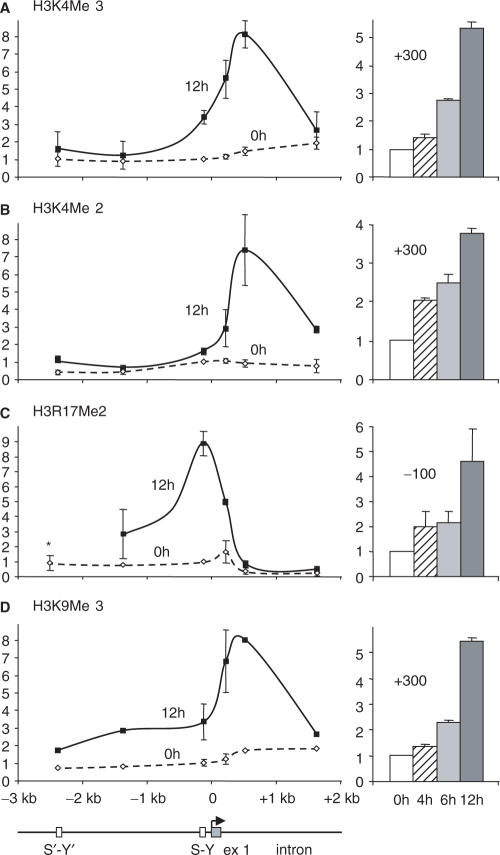
Posttranslational histone modifications associated with actively expressed genes are generally believed to be introduced primarily by histone-modifying enzymes that are recruited by transcription factors or their associated co-activators. We have performed a comprehensive spatial and temporal analyses of the histone modifications that are deposited upon activation of the MHC class II gene HLA-DRA by the co-activator CIITA. We find that transcription-associated histone modifications are introduced during two sequential phases. The first phase precedes transcription initiation and is characterized exclusively by a rapid increase in histone H4 acetylation over a large upstream domain. All other modifications examined, including the acetylation and methylation of several residues in histone H3, are restricted to short regions situated at or within the 5' end of the gene and are established during a second phase that is concomitant with ongoing transcription. This second phase is completely abrogated when elongation by RNA polymerase II is blocked. These results provide strong evidence that transcription elongation can play a decisive role in the deposition of histone modification patterns associated with inducible gene activation.


Figures

Figure 1.
Figure 1.
Precise timing of IFN-γ-induced HLA-DRA expression. (A) Molecular mechanism mediating IFN-γ-induced HLA-DRA expression. IFN-γ induces rapid expression of the gene coding for the transcriptional co-activator CIITA, which activates transcription of the HLA-DRA gene by associating with an enhanceosome complex that assembles at its proximal (S-Y) and distal (S′-Y′) regulatory modules. RFX is a key component of the enhanceosome complex. (B) Cell surface HLA-DR expression was measured by FACS in Me67.8 cells stimulated with IFN-γ for 0, 24 and 48 h. (C) The accumulation of CIITA and HLA-DRA mRNAs were quantified by real-time RT-PCR in IFN-γ-stimulated Me67.8 cells over a 48-h time period. Shading highlights a 4-h lag period between the induction of CIITA and HLA-DRA mRNA accumulation. Results are expressed relative to the values measured after 48 h. The mean and SD are shown for four experiments. (D) Occupation of the HLA-DRA S-Y and S′-Y′ modules by CIITA and RFX was measured by quantitative chromatin immunoprecipitation (ChIP) at the indicated times following stimulation with IFN-γ. Shaded bars highlight the occupation that is induced during the lag period preceding HLA-DRA gene activation. Results are expressed relative to the plateau values reached after 12 h. The mean and SD are shown for two experiments.
Figure 2.
Figure 2.
Spatial and temporal patterns of the induction of histone acetylation at the HLA-DRA gene. (A) The levels of H4 (top, H4Ac) and H3 (bottom, H3Ac) acetylation were measured by quantitative ChIP at different positions within the HLA-DRA gene in non-induced cells and cells treated with IFN-γ for 12 h. A schematic map of the HLA-DRA gene is shown below. (B) The levels of H4 (left) and H3 (right) acetylation were measured by quantitative ChIP at the indicated positions after induction with IFN-γ for the indicated times. For H4Ac, similar time courses were also observed at the other positions examined in (A) (data not shown). Asterisk denotes not measured in all experiments. All results are expressed relative to the value observed at the promoter in non-induced cells. The mean and SD are shown for four (H4Ac) and five (H3Ac) experiments.
Figure 3.
Figure 3.
Specificity of H4 acetylation induced at the HLA-DRA gene. (A) The levels of acetylation at lysines K5, K8, K12 and K16 of H4 were measured by quantitative ChIP at the HLA-DRA promoter after induction with IFN-γ for the indicated times. Similar results were obtained at the other positions in the region analyzed in (B) (data not shown). (B) Acetylation at H4K5 and H4K8 was measured by quantitative ChIP at the indicated positions in the HLA-DRA gene after 0 and 12 h of induction. All results are expressed relative to the value observed at the promoter in non-induced cells. The mean and SD are shown for two experiments.
Figure 4.
Figure 4.
Specificity of H3 acetylation induced at the HLA-DRA gene. (A) The levels of acetylation at lysines K9, K14, K23 and K27 of H3 were measured by quantitative ChIP at position +300 of the HLA-DRA gene after induction with IFN-γ for the indicated times. Similar results were obtained at the promoter and at +600 (data not shown). (B) H3 acetylation at K9 was measured by quantitative ChIP at the indicated positions in the HLA-DRA gene after 0 and 12 h of induction. All results are expressed relative to the value observed at the promoter in non-induced cells. The mean and SD are shown for three experiments.
Figure 5.
Figure 5.
Temporal relationship between the induction of histone acetylation, the recruitment of Pol II and the initiation of transcription. (A) H4 acetylation, H3 acetylation, recruitment of Pol II and the appearance of nascent chromatin-bound transcripts were quantified after the indicated times in IFN-γ-induced cells. For H4Ac, the results represent the mean and SD for measurements made in three to four experiments at four positions (−1.3, −0.1, +0.3 and +0.6 kb) in the HLA-DRA gene. For H3Ac, the results represent the mean and SD for measurements made in three to five experiments at three positions (−0.1, +0.3 and +0.6 kb) in the HLA-DRA gene. For nascent transcripts, the results represent the mean and SD for measurements made in two experiments at three positions (+0.3, +0.6 and +1.7 kb) within the HLA-DRA gene. For Pol II, results represent the mean and SD for measurements made at the promoter (−0.04 kb) in four experiments. Asterisk denotes not measured in all experiments. (B) Nascent chromatin-bound transcripts (open bars) and H3 acetylation (gray bars) were quantified in IFN-γ-induced cells after the indicated times. Results represent the mean and SD from two experiments.
Figure 6.
Figure 6.
Intergenic transcription induced by IFN-γ in the upstream region of the HLA-DRA gene. Intergenic transcripts were quantified by real-time RT-PCR at the indicated times and positions in the upstream region of the HLA-DRA gene. In the time course experiment (top), the results represent the mean and SD of measurements made in three experiments at six positions (−4.9, −3.5, −2.3, −1.8, −1.3 and −0.1 kb) in the upstream region. The spatial distribution (bottom) shows the mean and SD derived from three experiments in cells induced for 0 and 12 h. Asterisk denotes not measured in all experiments.
Figure 7.
Figure 7.
Temporal and spatial pattern of IFN-γ-induced H3 methylation. The induction of (A) H3K4Me2, (B) H3K4Me3, (C) H3R17Me2 and (D) H3K9Me3 modifications were assessed at the indicated times and positions in the HLA-DRA gene. In the left panels, results are presented for cells induced with IFN-γ for 0 and 12 h. In the right panels, time courses are shown for positions at which the modifications attain a peak. The mean and SD are shown for two experiments. Asterisk denotes not measured in all experiments.
Figure 8.
Figure 8.
Most IFN-γ-induced histone modifications deposited at the HLA-DRA gene are a consequence of active transcription. (A) The diagram depicts the protocol used to document the effect of DRB on IFN-γ-induced HLA-DRA gene activation. (B) The effect of DRB on the phosphorylation of Pol II was assessed by western blotting (left), whereas its effect on HLA-DRA promoter occupation by RFX (right) and CIITA (middle) was measured by ChIP. (C) HLA-DRA mRNA accumulation, the recruitment of Pol II at the promoter, and the levels of the indicated modifications were measured after 0, 6 and 12 h of induction with IFN-γ, and after 12 h of induction in the presence of DRB for the last 6 h. Results are shown for measurements made at the promoter (Pol II and R17Me2), at +300 (H4Ac, H3Ac, H3K4Me3, H3K4Me2 and H3K9Me3) and in exon 5 (H3K36Me3). Similar results were obtained at other positions in the modified regions (data not shown). The mean and SD are shown for two experiments. (D) Protein levels of the indicated histone modifying factors were measured by western blotting in cells treated as in panel C.

Similar articles

Cited by

References

    1. Kurdistani SK, Grunstein M. Histone acetylation and deacetylation in yeast. Nat. Rev. Mol. Cell Biol. 2003;4:276–284. - PubMed
    1. Martin C, Zhang Y. The diverse functions of histone lysine methylation. Nat. Rev. Mol. Cell Biol. 2005;6:838–849. - PubMed
    1. Wysocka J, Allis CD, Coonrod S. Histone arginine methylation and its dynamic regulation. Front Biosci. 2006;11:344–355. - PubMed
    1. Vakoc CR, Mandat SA, Olenchock BA, Blobel GA. Histone H3 lysine 9 methylation and HP1gamma are associated with transcription elongation through mammalian chromatin. Mol. Cell. 2005;19:381–391. - PubMed
    1. Wright KL, Ting JP. Epigenetic regulation of MHC-II and CIITA genes. Trends Immunol. 2006;27:405–412. - PubMed

Publication types