

Regional and tissue specific transcript signatures of ion channel genes in the non-diseased human heart
- PMID: 17478540
- PMCID: PMC2075332
- DOI: 10.1113/jphysiol.2006.126714
Regional and tissue specific transcript signatures of ion channel genes in the non-diseased human heart
Abstract
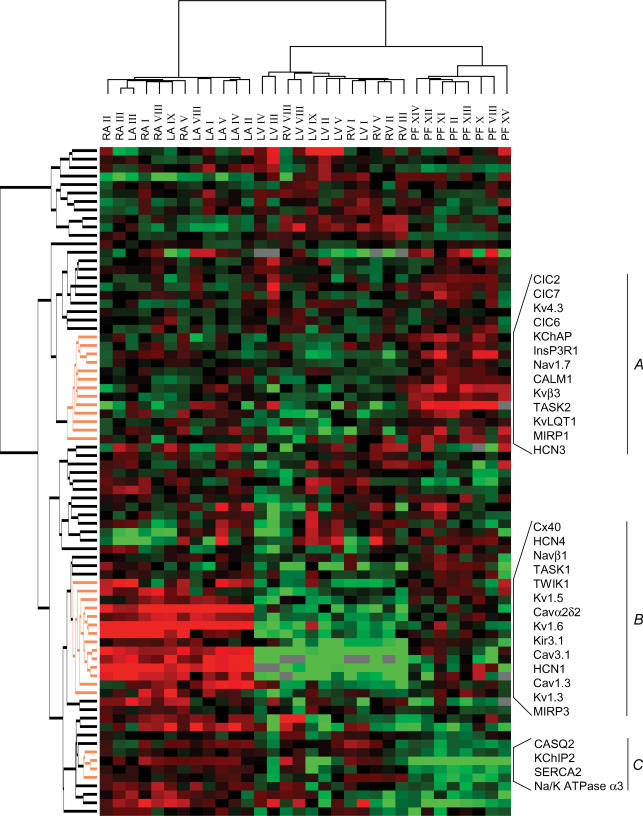
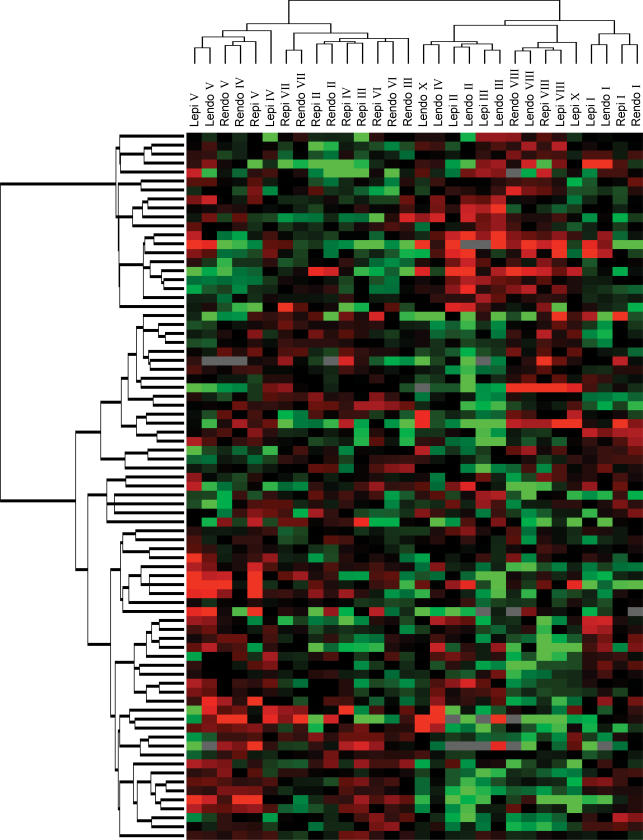
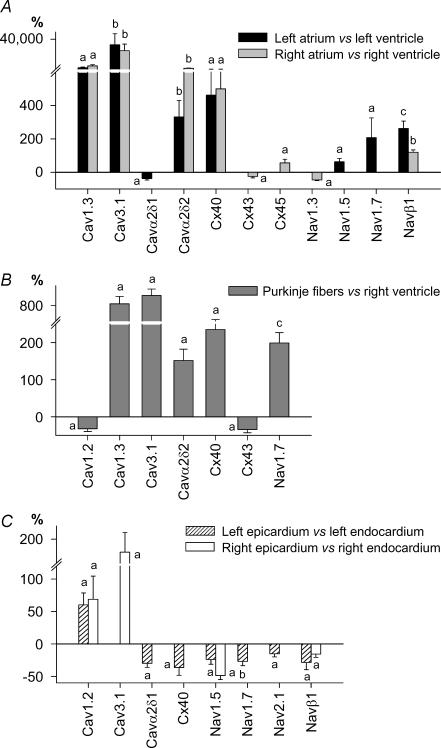
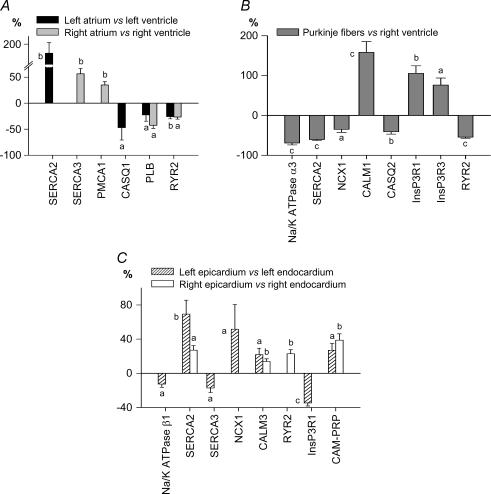
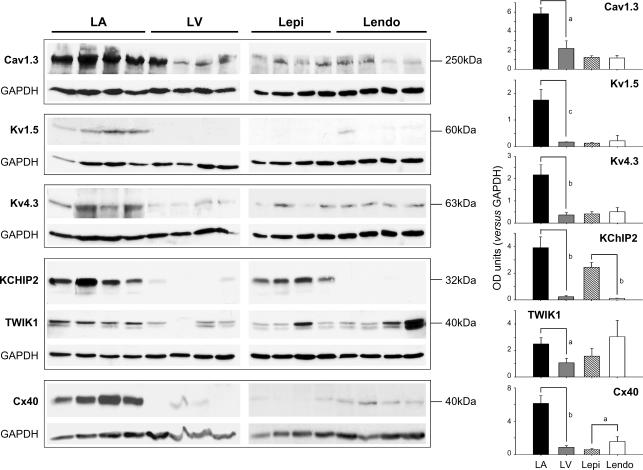
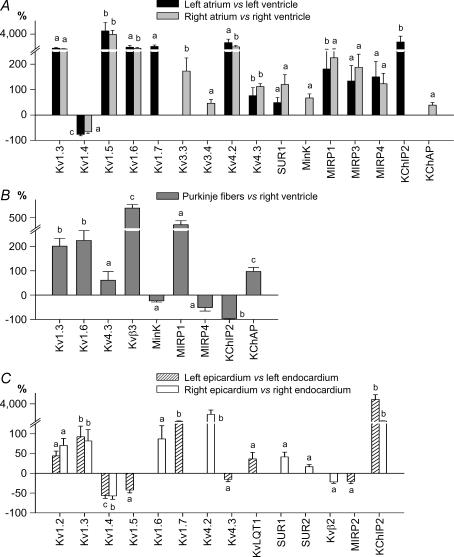
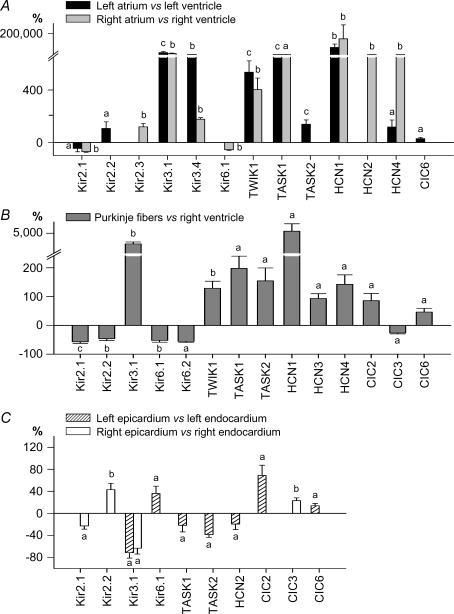
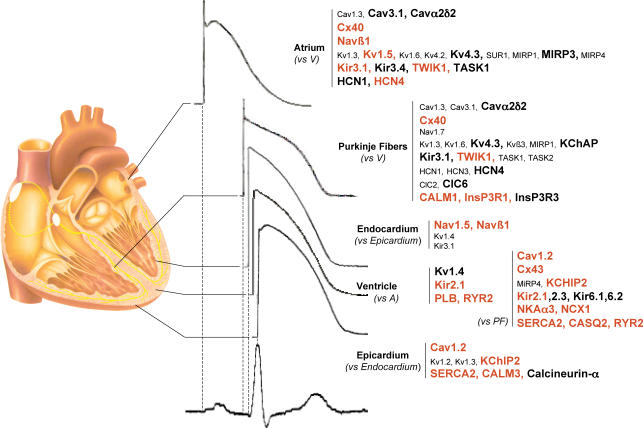
The various cardiac regions have specific action potential properties appropriate to their electrical specialization, resulting from a specific pattern of ion-channel functional expression. The present study addressed regionally defined differential ion-channel expression in the non-diseased human heart with a genomic approach. High-throughput real-time RT-PCR was used to quantify the expression patterns of 79 ion-channel subunit transcripts and related genes in atria, ventricular epicardium and endocardium, and Purkinje fibres isolated from 15 non-diseased human donor hearts. Two-way non-directed hierarchical clustering separated atria, Purkinje fibre and ventricular compartments, but did not show specific patterns for epicardium versus endocardium, nor left- versus right-sided chambers. Genes that characterized the atria (versus ventricles) included Cx40, Kv1.5 and Kir3.1 as expected, but also Cav1.3, Cav3.1, Cav alpha2 delta2, Nav beta1, TWIK1, TASK1 and HCN4. Only Kir2.1, RyR2, phospholamban and Kv1.4 showed higher expression in the ventricles. The Purkinje fibre expression-portrait (versus ventricle) included stronger expression of Cx40, Kv4.3, Kir3.1, TWIK1, HCN4, ClC6 and CALM1, along with weaker expression of mRNA encoding Cx43, Kir2.1, KChIP2, the pumps/exchangers Na(+),K(+)-ATPase, NCX1, SERCA2, and the Ca(2+)-handling proteins RYR2 and CASQ2. Transcripts that were more strongly expressed in epicardium (versus endocardium) included Cav1.2, KChIP2, SERCA2, CALM3 and calcineurin-alpha. Nav1.5 and Nav beta1 were more strongly expressed in the endocardium. For selected genes, RT-PCR data were confirmed at the protein level. This is the first report of the global portrait of regional ion-channel subunit-gene expression in the non-diseased human heart. Our data point to significant regionally determined ion-channel expression differences, with potentially important implications for understanding regional electrophysiology, arrhythmia mechanisms, and responses to ion-channel blocking drugs. Concordance with previous functional studies suggests that regional regulation of cardiac ion-current expression may be primarily transcriptional.
Figures
Comment in
-
Variety is the spice of life: searching for the substrates of regional myocardial electrical properties.J Physiol. 2007 Jul 15;582(Pt 2):473. doi: 10.1113/jphysiol.2007.136929. Epub 2007 May 31. J Physiol. 2007. PMID: 17540696 Free PMC article. No abstract available.
References
-
- Abbott GW, Sesti F, Splawski I, Buck ME, Lehmann MH, Timothy KW, Keating MT, Goldstein SA. MiRP1 forms IKr potassium channels with HERG and is associated with cardiac arrhythmia. Cell. 1999;97:175–187. - PubMed
-
- Antzelevitch C. Cellular basis and mechanism underlying normal and abnormal myocardial repolarization and arrhythmogenesis. Ann Med. 2004;36:5–14. - PubMed
-
- Barth AS, Merk S, Arnoldi E, Zwermann L, Kloos P, Gebauer M, Steinmeyer K, Bleich M, Kaab S, Pfeufer A, Uberfuhr P, Dugas M, Steinbeck G, Nabauer M. Functional profiling of human atrial and ventricular gene expression. Pflugers Arch. 2005;450:201–208. - PubMed
-
- Brahmajothi MV, Campbell DL, Rasmusson RL, Morales MJ, Trimmer JS, Nerbonne JM, Strauss HC. Distinct transient outward potassium current (Ito) phenotypes and distribution of fast-inactivating potassium channel α subunits in ferret left ventricular myocytes. J Gen Physiol. 1999;113:581–600. - PMC - PubMed
Publication types
MeSH terms
Substances
LinkOut - more resources
Full Text Sources
Other Literature Sources
Molecular Biology Databases
Miscellaneous