

Construction of a microarray specific to the chicken immune system: profiling gene expression in B cells after lipopolysaccharide stimulation
- PMID: 17479774
- PMCID: PMC1829180
Construction of a microarray specific to the chicken immune system: profiling gene expression in B cells after lipopolysaccharide stimulation
Abstract
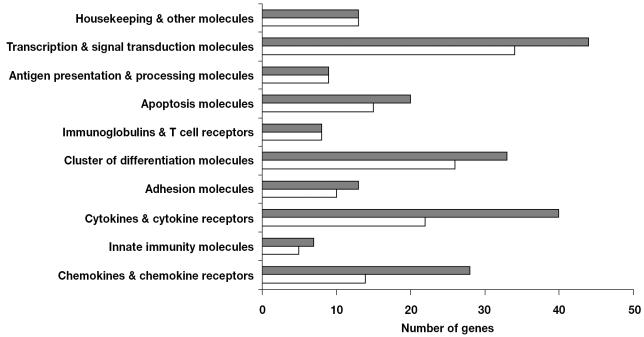
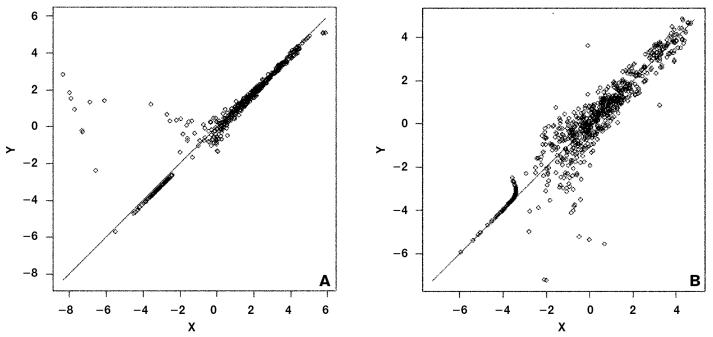
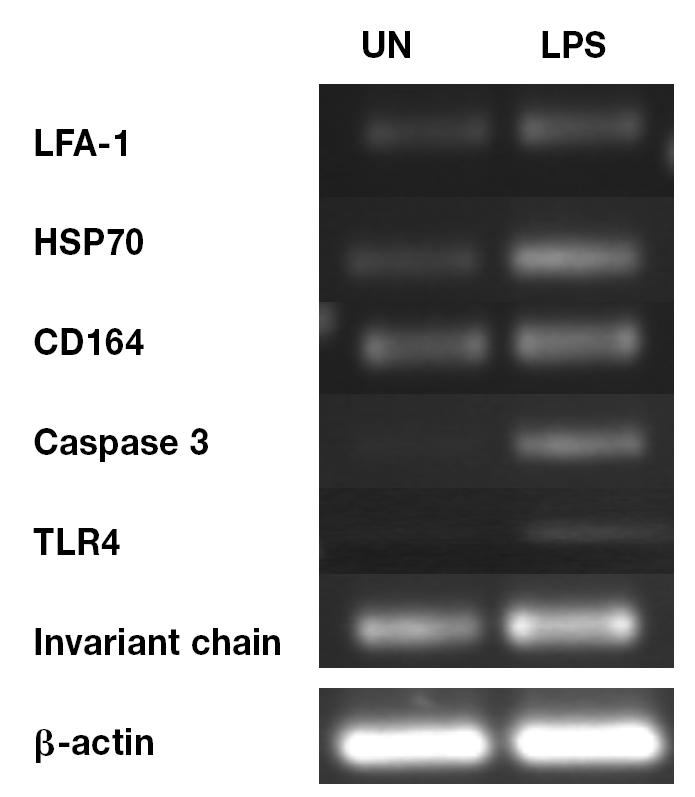
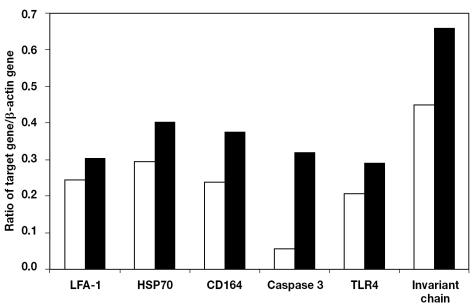
The objective of this study was to profile gene expression in cells of the chicken immune system. A low-density immune-specific microarray was constructed that contained genes with known functions in the chicken immune system, in addition to chicken-expressed sequence tags (ESTs) homologous with mammalian immune system genes, which were systematically characterized by bioinformatic analyses. Genes and ESTs that met the annotation criteria were amplified and placed on a microarray. The microarray contained 84 immune system gene elements. As a means of calibration, the microarray was then used to examine gene expression in chicken B cells after lipopolysaccharide stimulation. Differential gene expression was observed at 6, 12, and 24 h but not at 48 h after stimulation. The results were validated by semiquantitative polymerase chain reaction. The microarray showed a high degree of reproducibility, as demonstrated by intra- and interassay correlation coefficients of 0.97 and 0.95, respectively. Thus, the low-density microarray developed in this study may be used as a tool for monitoring gene expression in the chicken immune system.
La présente étude avait comme objectif d’étudier l’expression génique dans les cellules du système immunitaire du poulet. Une biopuce de faible densité, spécifique du système immunitaire, a été construite et contenait des gènes avec des fonctions connues dans le système immunitaire du poulet, de même que des séquences étiquettes exprimées chez le poulet (ESTs) mais homologues à des gènes du système immunitaire des mammifères, caractérisés systématiquement par analyses bio-informatiques. Les gènes et ESTs qui rencontraient les critères d’annotation ont été amplifiés et placés sur une biopuce. La biopuce contenait 84 éléments génétiques du système immunitaire. Comme méthode de calibration, la biopuce a été utilisée pour examiner l’expression génique des cellules B de poulet après stimulation par le lipopolysaccharide. Une expression génique différentielle a été observée 6, 12, et 24 h après la stimulation mais pas après 48 h. Les résultats ont été validés par réaction d’amplification en chaîne par la polymérase semi-quantitative. La biopuce avait une excellente reproductibilité tel que démontré par les coefficients de corrélation intra- et inter-essai qui étaient respectivement de 0,97 et 0,95. Donc, la biopuce de faible densité développée au cours de cette étude peut être utilisée comme outil pour surveiller l’expression génique du système immunitaire du poulet.
(Traduit par Docteur Serge Messier)
Figures
References
-
- Cogburn LA, Wang X, Carre W, et al. Systems-wide chicken DNA microarrays, gene expression profiling, and discovery of functional genes. Poultry Sci. 2003;82:939–951. - PubMed
-
- Koskela K, Kohonen P, Nieminen P, Buerstedde JM, Lassila O. Insight into lymphoid development by gene expression profiling of avian B cells. Immunogenetics. 2003;55:412–422. - PubMed
-
- Karaca G, Anobile J, Downs D, Burnside J, Schmidt CJ. Herpesvirus of turkeys: microarray analysis of host gene responses to infection. Virology. 2004;318:102–111. - PubMed
Publication types
MeSH terms
Substances
LinkOut - more resources
Full Text Sources
Research Materials
Miscellaneous