. 2007 May 3;54(3):447-60.
doi: 10.1016/j.neuron.2007.04.010.

Diffusional trapping of GluR1 AMPA receptors by input-specific synaptic activity

Affiliations

Diffusional trapping of GluR1 AMPA receptors by input-specific synaptic activity

Michael D Ehlers et al. Neuron. .

Abstract

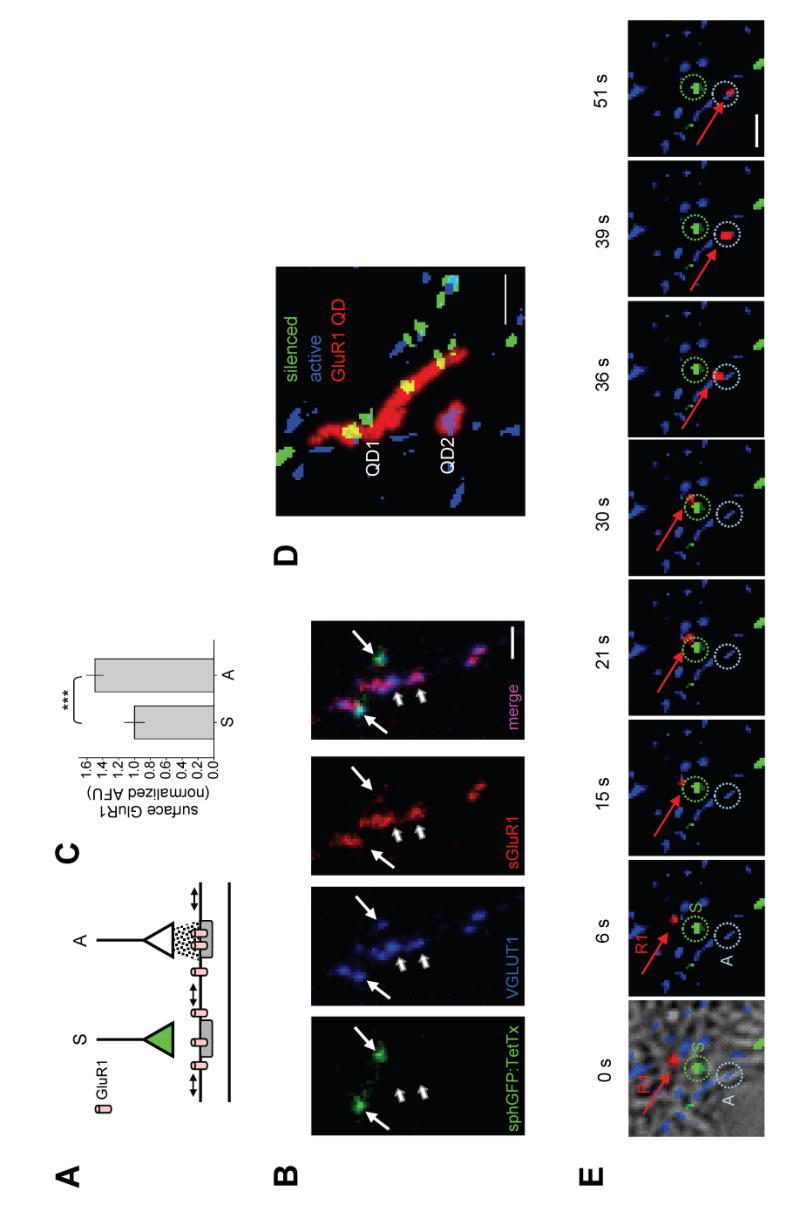
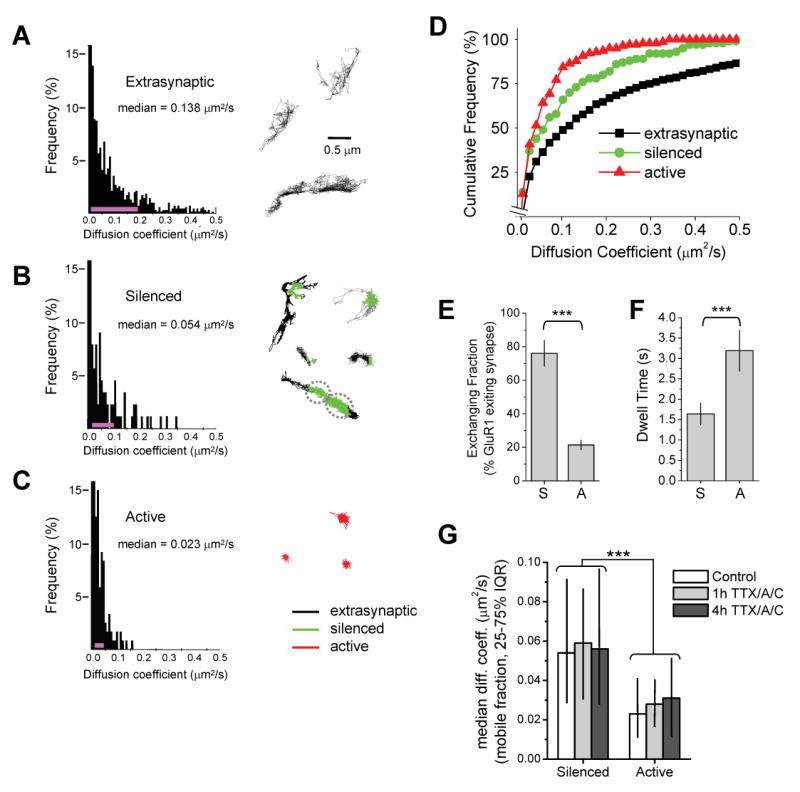
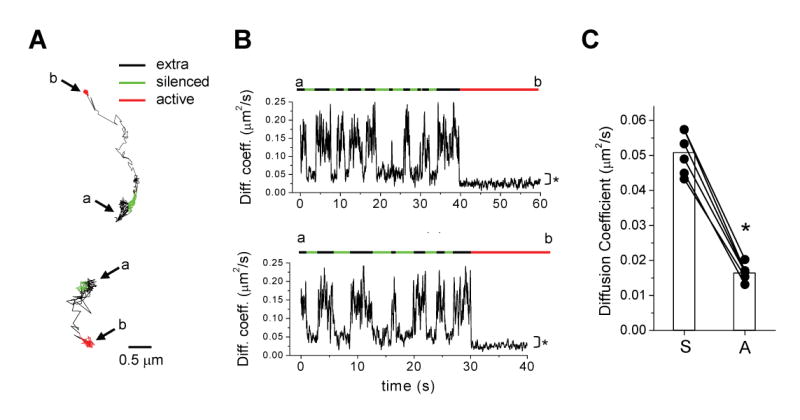
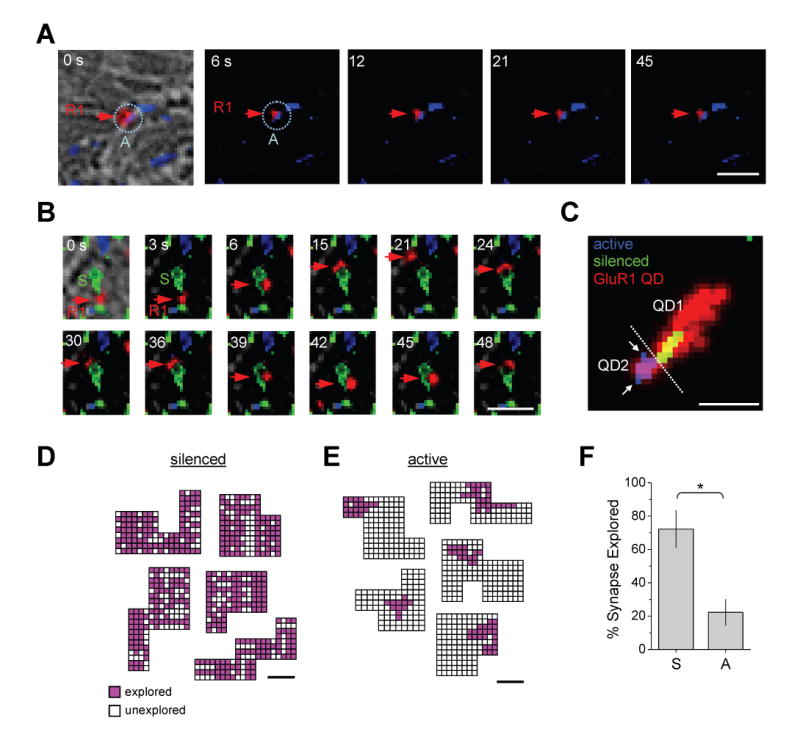
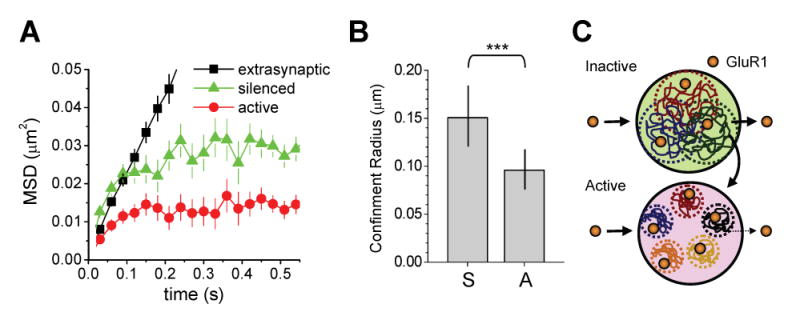
Synaptic activity regulates the postsynaptic accumulation of AMPA receptors over timescales ranging from minutes to days. Indeed, the regulated trafficking and mobility of GluR1 AMPA receptors underlies many forms of synaptic potentiation at glutamatergic synapses throughout the brain. However, the basis for synapse-specific accumulation of GluR1 is unknown. Here we report that synaptic activity locally immobilizes GluR1 AMPA receptors at individual synapses. Using single-molecule tracking together with the silencing of individual presynaptic boutons, we demonstrate that local synaptic activity reduces diffusional exchange of GluR1 between synaptic and extraynaptic domains, resulting in postsynaptic accumulation of GluR1. At neighboring inactive synapses, GluR1 is highly mobile with individual receptors frequently escaping the synapse. Within the synapse, spontaneous activity confines the diffusional movement of GluR1 to restricted subregions of the postsynaptic membrane. Thus, local activity restricts GluR1 mobility on a submicron scale, defining an input-specific mechanism for regulating AMPA receptor composition and abundance.


Figures

Figure 1
Figure 1. GluR1 is Stabilized at Active Synapses but Rapidly Moves Through Inactive Synapses
(A) Schematic diagram of experimental approach. GluR1 movement is visualized on a postsynaptic dendrite that receives synaptic contact from a neuron expressing synaptophysin-GFP:IRES:TetTx (green) whose presynaptic boutons are visible as green due to expression of synaptophysin-GFP but do not release glutamate (silenced, S) due to co-expression of tetanus toxin light chain (TetTx). The same dendrite receives nearby input from an untransfected neuron (white) which is spontaneously active (A). All presynaptic boutons are visualized live by Mitotracker Red. See Experimental Procedures for details. (B) Spontaneous activity recruits GluR1. Hippocampal neurons were infected with lentivirus expressing synaptophysin-GFP:IRES:TetTx. Prior to visualization, neurons were incubated live with a polyclonal antibody directed against the extracellular N-terminal domain of GluR1 to label surface GluR1 (sGluR1). Neurons were then fixed and inactivated synapses visualized by synaptophysin-GFP fluorescence (sphGFP). Glutamatergic terminals were visualized by immunocytochemical detection of the vesicular glutamate transporter VGLUT1. Surface GluR1 was detected by labeling with fluorescent anti-rabbit secondary antibody. Triple overlap appears magenta (short arrows). Lack of sGluR1 appears cyan (long arrows). Note that inactivated synapses expressing synaptophysin-GFP (long arrows) had much less surface GluR1 than nearby active synapses (short arrows). Scale bars, 5 μm. (C) Data represent means ± SEM of surface anti-GluR1 immunocytochemical labeling at silenced (S) or active (A) synapses. Silenced, n = 46 synapses on 9 neurons from 4 coverslips. Active, n = 82 synapses on 5 neurons from 4 coverslips. AFU, arbitrary fluorescence units. ***p < 0.01; t-test. (D) Maximum projections of two quantum dot-labeled GluR1 receptors (GluR1-QD, red) near silenced (green) and active (blue) synapses. The total area explored by the two GluR1-QDs (labeled QD1 and QD2) during the 52 sec imaging period is indicated by red traces. Note that GluR1 moves readily through and between inactive synapses (QD1) but remains near an active synapse (QD2). Scale bar,2 μm. See Supplemental Movie S1. (E) Individual frames from a timelapse showing a single GluR1-QD (R1, red arrow) that moves rapidly through a silenced synapse (S, green dashed circle) before encountering and remaining at a nearby active synapse (A, blue dashed circle). Time in seconds is shown above. Scale bar, 1 μm. See Supplemental Movie S2.
Figure 2
Figure 2. Local Spontaneous Synaptic Activity Reduces GluR1 Diffusion
(A) Surface diffusion of extrasynaptic GluR1. Left, histogram of GluR1 diffusion coefficients (D) in the extrasynaptic plasma membrane (n = 1478 trajectories reconstructed from 69 image fields on 13 coverslips, median D value is shown). The pink line indicates the 25–75% interquartile range (IQR). Right, examples of GluR1 trajectories over extrasynaptic dendritic regions. (B) Diffusion of GluR1 at silenced synapses. Left, histogram of GluR1 diffusion coefficients during episodes spent in inactive synapses (n = 125 trajectories reconstructed from 34 image fields on 13 coverslips, median D value is shown). Pink line, 25–75% IQR. Right, examples of GluR1 trajectories near silenced synapses (green). Trajectory color code as in (C). (C) Diffusion of GluR1 at active synapses. Left, histogram of GluR1 diffusion coefficients during episodes spent in active synapses (n = 175 trajectories reconstructed from 26 image fields on 11 coverslips, median D value is shown). Pink line, 25–75% IQR. Right, examples of GluR1 trajectories at active synapses (red). The distributions in (A)–(C) are statistically different (p < 0.0001 for each pairwise comparison, Mann-Whitney test). (D) Cumulative probability plot of GluR1 diffusion coefficients. GluR1 exhibits slower diffusion at active synapses relative to silenced synapses and at all synapses relative to extrasynaptic membrane. (E) GluR1 receptors frequently exit silenced synapses. Data represent means ± SEM of the percent GluR1-QDs present at silenced (S) or active (A) synapses which leave the synapse during any portion of the 60 sec imaging period. ***p < 0.001, t-test. (F) Exchanging GluR1 receptors remain for longer periods at active synapses. Data represent means ± SEM of the dwell times of GluR1-QDs at silenced (S) or active (A) synapses. Note that only GluR1-QDs which depart the synapse are included in the analysis. ***p < 0.001, t-test. (G) Acute activity blockade does not alter GluR1 mobility at previously active or previously silenced synapses. Hippocampal cultures infected with synaptophysin-GFP:IRES:TetTx on DIV7 were incubated with 1 μM TTX, 50 μM D-AP5 (A), and 10 μM CNQX (C) for one or four hours before imaging on DIV15. Data represent median diffusion coefficents. IQR, interquartile range. Note that acute treatment with TTX/A/C did not alter GluR1 diffusion at either chronically silenced synapses expressing synaptophysin-GFP:IRES:TetTx or neighboring active synapses. Control, n = 125, 175 trajectories at silenced and active synapses, respectively. One hour TTX/A/C, n = 13, 11; 4 hours TTX/A/C, n = 15, 19. *** p < 0.001 for all pairwise comparisons between previously active and silenced synapses, Mann-Whitney test.
Figure 3
Figure 3. Active Synapses Capture GluR1 Released from Inactive Synapses by Diffusional Exchange
(A) Movement of GluR1 from silenced to active synapses. Shown are example trajectories of GluR1-QDs which begin in a silenced synapse (green), escape the synapse (black, extrasynaptic), and move to an adjacent active synapse (red). The start point (a) and end point (b) of the trajectories are indicated. (B) Plots of instantaneous diffusion coefficient versus time for the trajectories shown in (A). Overlying bars indicate episodes within extrasynaptic domains (black), silenced synapses (green), or active synapses (red). The start point (a) and end point (b) of the trajectories are indicated. GluR1 exchanges frequently in and out of inactive synapses but remains fixed and immobilized at an active synapse. Note the difference in diffusion coefficient during episodes in silenced and active synapses (*p < 0.0001, Mann-Whitney test). (C) Single GluR1-QDs exhibit reduced diffusion at active synapses. Each data point represents a single GluR1-QD which began in a silenced synapse (S) and subsequently moved to an active synapse (A). Bars indicate means. n = 6 trajectories, *p < 0.001, paired t-test.
Figure 4
Figure 4. GluR1 Explores the Interior of Inactive Synapses
(A) Individual frames from a timelapse showing a single GluR1-QD (R1, red arrow) immobilized at an active synapse (A, blue dashed circle). Time in seconds is shown. Scale bar, 1 μm. See Supplemental Movie S3. (B) Individual frames from a timelapse showing a single GluR1-QD (R1, red arrow) moving rapidly within and near a silenced synapse (S, green). Time in seconds is shown. Scale bar, 1 μm. See Supplemental Movie S4. (C) Maximum projections of two quantum dot-labeled GluR1 receptors (GluR1 QD, red) at adjacent silenced (green) and active (blue) synapses. The total area explored by the two receptors (labeled QD1 and QD2) during the 55 s imaging period is indicated by red traces separated by the dashed white line. Note that GluR1 moves readily into and out of inactive synapses with a trajectory that covers the entire synaptic domain (QD1), but remains fixed to a synaptic subregion at the adjacent active synapse (QD2). Arrows indicate unexplored portions of the synapse. Scale bar, 1 μm. (D) Single GluR1-QDs explore large areas within inactive synapses. Shown are five synaptic regions defined as a set of connected pixels obtained using object segmentation by wavelet transform. Each pixel was divided into 0.0016 μm2 subdomains and coded based on the presence (pink) or absence (white) of the GluR1-QD at any time during the imaging period as defined by the centroid of a two-dimensional Gaussian function fit to the GluR1-QD fluorescent signal (see Experimental Procedures for details). Coded areas at each synaptic region represent the trajectory of one GluR1-QD. Scale bar, 0.2 μm. (E) GluR1 explores only small subregions within active synapses. Objects, color code, and scale bar as in (D). (F) Data represent means ± SEM of the percent of the synaptic surface explored by GluR1-QDs at silenced (S) and active (A) synapses. Silenced, 72.2 ± 11.2% of the synapse explored, range from 58.7 – 94.1%, n = 11 synapses on 4 neurons from 3 coverslips. Active, 22.3 ± 7.7% explored, range from 10.0 – 35.0%, n = 13 synapses on 3 neurons from 3 coverslips. *p < 0.01; t-test.
Figure 5
Figure 5. Spontaneous Activity Confines GluR1 Movement Inside Synapses
(A) Mean square displacement (MSD) versus time for GluR1-QDs in the indicated compartments. Extrasynaptic GluR1 undergoes free diffusion without confinement as indicated by the linear MSD curve. GluR1 receptors at synapses exhibit confined movement within a zone whose radius is defined by the maximum MSD value approached at the t = ∞ limit. Error bars indicate SD. (B) GluR1 diffusion is more confined at active synapses. Data represent means ± SD of the confinement radius for GluR1 lateral movement in silenced (S) and active (A) synapses, as determined by the MSD curves in (A). Silenced, n = 125 trajectories reconstructed from 34 image fields on 13 coverslips. Active, n = 175 trajectories reconstructed from 26 image fields on 11 coverslips. ***p < 0.01, ANOVA. (C) A schematic model for GluR1 lateral diffusion at active and inactive synapses viewed en face. Input-specific spontaneous synaptic activity reduces receptor mobility, limits exchange with the extrasynaptic membrane, and confines GluR1 within small subdomains of the postsynaptic membrane. This diffusional trap leads to GluR1 accumulation at active synapses. See text for details.

References

    1. Adesnik H, Nicoll RA, England PM. Photoinactivation of native AMPA receptors reveals their real-time trafficking. Neuron. 2005;48:977–985. - PubMed
    1. Ahnert-Hilger G, Kutay U, Chahoud I, Rapoport T, Wiedenmann B. Synaptobrevin is essential for secretion but not for the development of synaptic processes. Eur J Cell Biol. 1996;70:1–11. - PubMed
    1. Allison DW, Gelfand VI, Spector I, Craig AM. Role of actin in anchoring postsynaptic receptors in cultured hippocampal neurons: differential attachment of NMDA versus AMPA receptors. J Neurosci. 1998;18:2423–2436. - PMC - PubMed
    1. Anderson MJ, Cohen MW. Nerve-induced and spontaneous redistribution of acetylcholine receptors on cultured muscle cells. J Physiol. 1977;268:757–773. - PMC - PubMed
    1. Ashby MC, De La Rue SA, Ralph GS, Uney J, Collingridge GL, Henley JM. Removal of AMPA receptors (AMPARs) from synapses is preceded by transient endocytosis of extrasynaptic AMPARs. J Neurosci. 2004;24:5172–5176. - PMC - PubMed

Publication types

Substances