Comparative Study
. 2007 Jun 15;221(3):349-62.
doi: 10.1016/j.taap.2007.03.023. Epub 2007 Mar 30.

Interactive toxicity of inorganic mercury and trichloroethylene in rat and human proximal tubules: effects on apoptosis, necrosis, and glutathione status

Affiliations
Comparative Study

Interactive toxicity of inorganic mercury and trichloroethylene in rat and human proximal tubules: effects on apoptosis, necrosis, and glutathione status

Lawrence H Lash et al. Toxicol Appl Pharmacol. .

Abstract

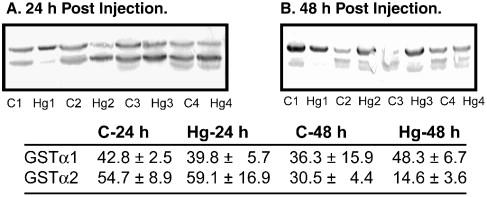
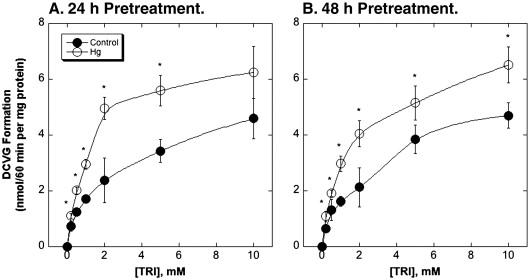
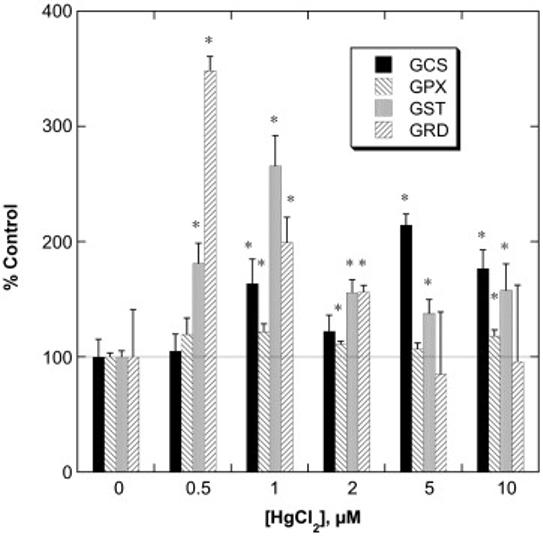
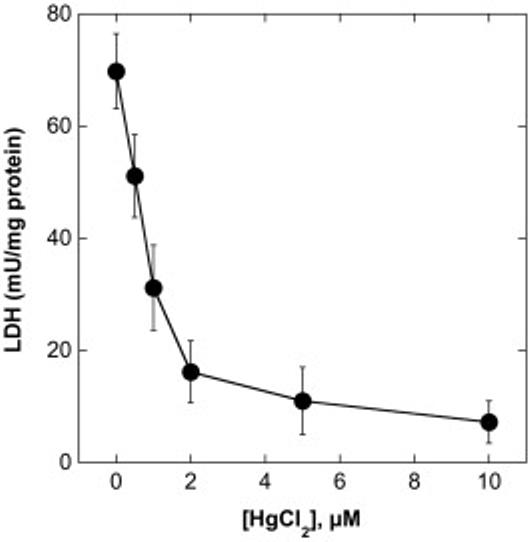
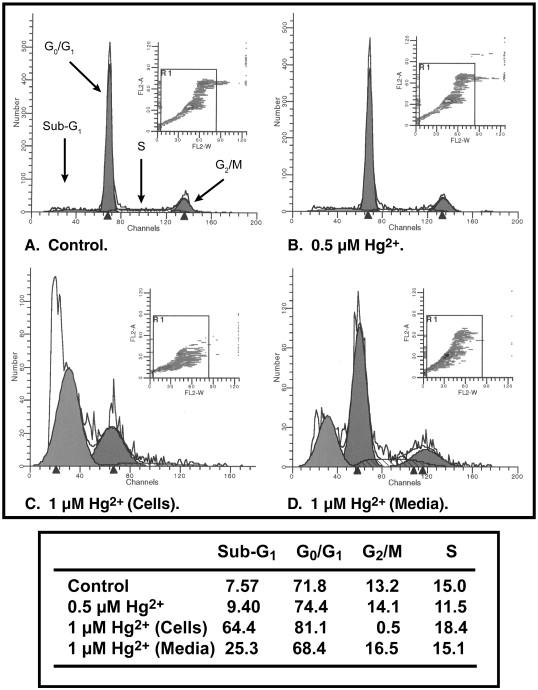
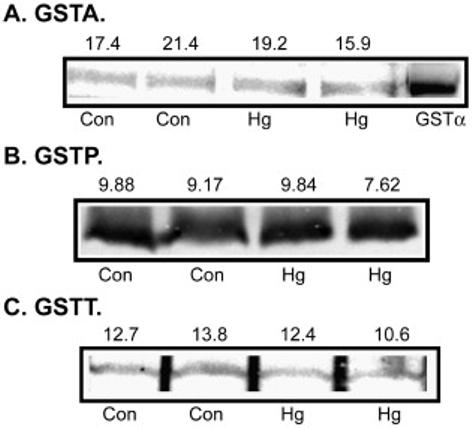
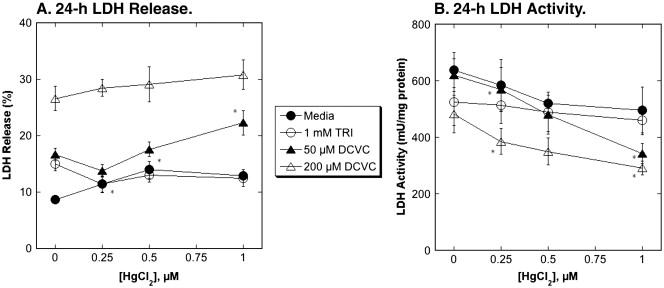
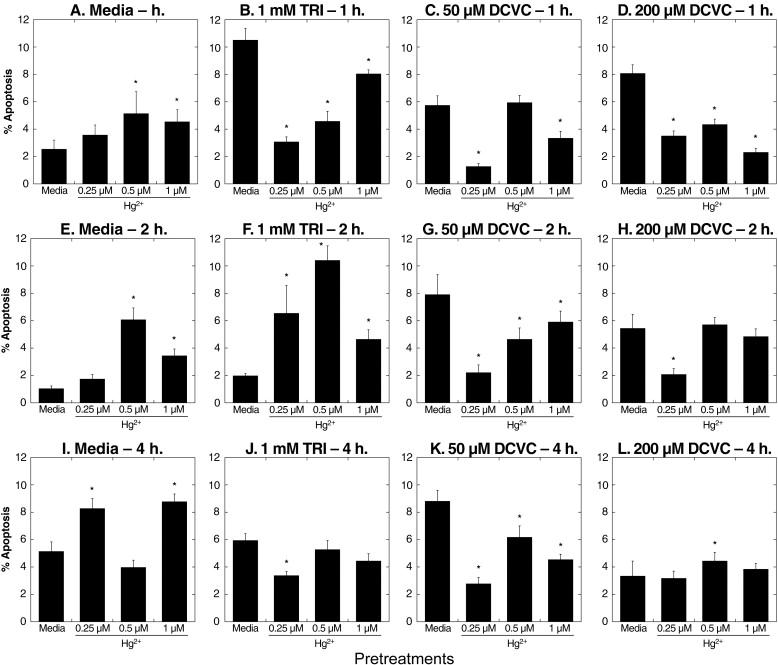
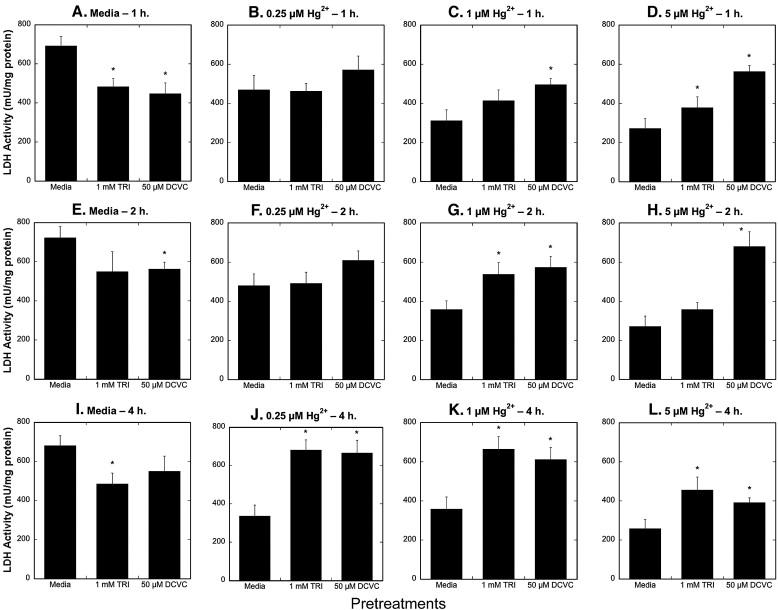
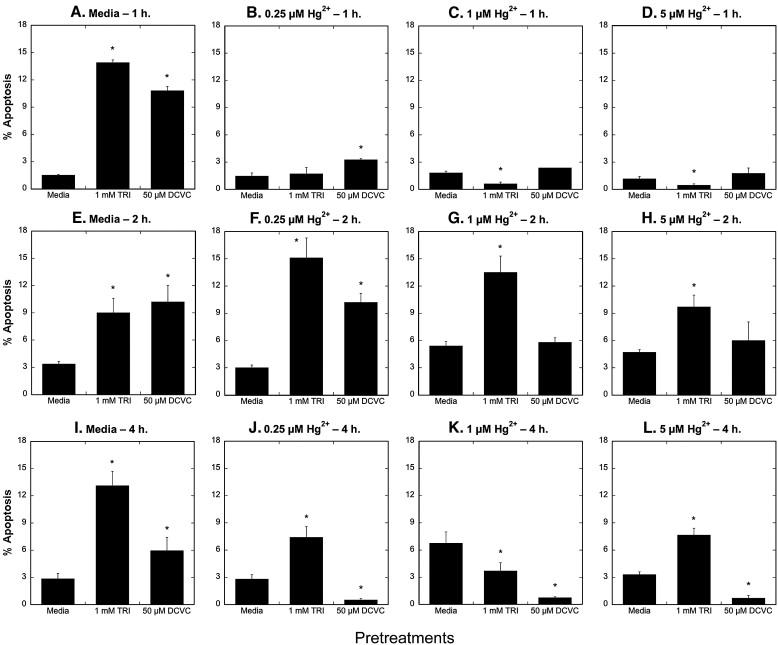
Simultaneous or prior exposure to one chemical may alter the concurrent or subsequent response to another chemical, often in unexpected ways. This is particularly true when the two chemicals share common mechanisms of action. The present study uses the paradigm of prior exposure to study the interactive toxicity between inorganic mercury (Hg(2+)) and trichloroethylene (TRI) or its metabolite S-(1,2-dichlorovinyl)-l-cysteine (DCVC) in rat and human proximal tubule. Pretreatment of rats with a subtoxic dose of Hg(2+) increased expression of glutathione S-transferase-alpha1 (GSTalpha1) but decreased expression of GSTalpha2, increased activities of several GSH-dependent enzymes, and increased GSH conjugation of TRI. Primary cultures of rat proximal tubular (rPT) cells exhibited both necrosis and apoptosis after incubation with Hg(2+). Pretreatment of human proximal tubular (hPT) cells with Hg(2+) caused little or no changes in GST expression or activities of GSH-dependent enzymes, decreased apoptosis induced by TRI or DCVC, but increased necrosis induced by DCVC. In contrast, pretreatment of hPT cells with TRI or DCVC protected from Hg(2+) by decreasing necrosis and increasing apoptosis. Thus, whereas pretreatment of hPT cells with Hg(2+) exacerbated cellular injury due to TRI or DCVC by shifting the response from apoptosis to necrosis, pretreatment of hPT cells with either TRI or DCVC protected from Hg(2+)-induced cytotoxicity by shifting the response from necrosis to apoptosis. These results demonstrate that by altering processes related to GSH status, susceptibilities of rPT and hPT cells to acute injury from Hg(2+), TRI, or DCVC are markedly altered by prior exposures.


Figures

Figure 1
Figure 1. Effects of pretreatment with Hg2+ on GSTα expression in rat kidney cytoplasm
Rats were pretreated ip with a non-toxic dose of HgCl2 (0.5 μmol/kg) for 24 or 48 h. Expression of GSTα isoforms were determined by immunoblot analysis, using a polyclonal antibody to rat GSTα, which recognizes both GSTα1 (top band) and GSTα2 (lower band). Densities of bands were determined with Image J software (v. 1.34s). In some samples, a third band was visible below the GSTα2 band. This band was not identified, but was attributed to minor cross-reactivity. Band density results are means ± SE of measurements from 4 separate control rats and 4 separate Hg2+-treated rats at each time point.
Figure 2
Figure 2. Effects of pretreatment with Hg2+ on GSH conjugation of TRI in rat kidney cytoplasm
Rats were pretreated ip with a non-toxic dose of HgCl2 (0.5 μmol/kg) for 24 or 48 h. Cytoplasm was isolated from rat kidney cortex of either control or Hg2+-pretreated rats by differential centrifugation. GSH conjugation of TRI was measured by incubating cytoplasm (1 mg protein/ml) with 5 mM GSH and the indicated concentrations of TRI at 37°C for up to 60 min. Reactions were stopped by addition of 10% (w/v) perchloric acid and acid extracts were analyzed for formation of DCVG by ion-exchange HPLC. Results, given for 60-min incubations, are the means ± SE of measurements from separate cytoplasm preparations from 4 control and 4 Hg2+-pretreated rats. *Significantly different (P < 0.05) from corresponding incubations from control rat kidneys.
Figure 3
Figure 3. Effects of pretreatment of primary cultures of rPT cells with Hg2+ on activities of GSH-dependent enzymes
Confluent, primary cultures of rPT cells were incubated with the indicated concentrations of HgCl2 for 24 h. Activities of γ-glutamylcysteine synthetase (GCS), glutathione peroxidase (GPX), glutathione S-transferase (GST), and glutathione disulfide reductase (GRD) were measured in cellular homogenates by spectrophotometric assays. Control activities (= 100%; in mU/mg protein) were 611 ± 93, 237 ± 8, 64.0 ± 3.4, and 2.40 ± 0.99 for GCS, GPX, GST, and GRD, respectively. Results are expressed as the percent of control ± SE for measurements from 3 separate cultures for each concentration of Hg2+. *Significantly different (P < 0.05) from the corresponding control sample.
Figure 4
Figure 4. Hg2+-induced inactivation of LDH activity in primary cultures of rPT cells
Confluent, primary cultures of rPT cells were grown on 35-mm culture dishes and were incubated with the indicated concentrations of HgCl2 for 24 h. Cellular necrosis was determined by measurement of total LDH activity. Results are means ± SE of measurements from 4 to 6 separate cell cultures.
Figure 5
Figure 5. Hg2+-induced apoptosis in primary cultures of rPT cells
Confluent, primary cultures of rPT cells were grown on 35-mm culture dishes and were incubated with either media (= Control) or 0.5 μM or 1 μM HgCl2 for 24 h. At 1 μM HgCl2, a significant portion of cells became detached from the growth surface. Accordingly, cells remaining on the culture dish and those that were detached after treatment with 1 μM HgCl2 were separately analyzed. Apoptosis and cell cycle distribution were assessed by staining with propidium iodide and flow cytometry with a Becton Dickinson FACSCalibur flow cytometer. Peaks from left to right represent apoptotic (sub-G1) cells and cells in G0/G1, G2/M, and S phases. Insets: Distribution of cells according to fluorescence intensity. Cells outside the box were those excluded from analysis due to aggregation. Values in the table are the percentage of cells undergoing apoptosis and the fraction of cells in each phase of the cell cycle.
Figure 6
Figure 6. Effects of pretreatment of primary cultures of hPT cells with Hg2+ on GST isoenzyme expression
Confluent, primary cultures of hPT cells were grown on collagen-coated T-25 flasks and were incubated with 0.5 μM HgCl2 for 24 h. Expression of GSTA (A), GSTP (B), and GSTT (C) were determined in total cell extracts by immunoblot analysis, using polyclonal antibodies specific for each GST isoenzyme. For GSTA, an additional sample of purified rat GSTα was run. Numbers above each panel represent total pixel densities of each band as determined with Image J software.
Figure 7
Figure 7. Effects of pretreatment of primary cultures of hPT cells with Hg2+ on TRI- and DCVC-induced necrosis
Confluent, hPT cell cultures were pretreated for 24 h with either media (= Control) or 0.25, 0.5, or 1 μM HgCl2. Cells from the four pretreatment groups were then incubated for 24 h with either media, 1 mM TRI, or 50 or 200 μM DCVC. LDH activity was measured in media and in cells solubilized with 0.1% (v/v) Triton X-100. Results are expressed as either percent LDH release (A) or total LDH activity (B) and are means ± SE of measurements from 3 separate cell cultures. *Significantly different (P < 0.05) from corresponding samples preincubated with media.
Figure 8
Figure 8. Effects of pretreatment of primary cultures of hPT cells with 0.25 μM Hg2+ on TRI- and DCVC-induced apoptosis
Confluent, hPT cell cultures were pretreated for 24 h with either media (= Control) or 0.25 μM HgCl2. Cells from the two pretreatment groups were then incubated for 1 h with either media, 1 mM TRI, or 50 μM DCVC. Apoptosis was assessed by staining with propidium iodide and flow cytometry using a Becton Dickinson FACSCalibur flow cytometer. Peaks from left to right represent apoptotic (sub-G1) cells and cells in G0/G1, G2/M, and S phases. Insets: Distribution of cells according to fluorescence intensity. Cells outside the box were those excluded from analysis due to aggregation. Values above the arrows indicate the percentage of apoptotic cells in each sample.
Figure 9
Figure 9. Time and dose dependence of effects of pretreatment of primary cultures of hPT cells with Hg2+ on TRI- and DCVC-induced apoptosis
Confluent, hPT cell cultures were pretreated for 24 h with 0 (= Media/Control), 0.25, 0.5, or 1 μM HgCl2. Cells from the four pretreatment groups were then incubated for 1, 2, or 4 h with either media, 1 mM TRI, or 50 or 200 μM DCVC. Cells were analyzed for apoptosis by flow cytometry as described in the legend to Fig. 8. Results are means ± SE of measurements from 3 separate cell cultures. *Significantly different (P < 0.05) from corresponding samples preincubated with media.
Figure 10
Figure 10. Effects of pretreatment of primary cultures of hPT cells with TRI or DCVC on Hg2+-induced necrosis
Confluent, hPT cell cultures were pretreated for 24 h with either media (= Control), 1 mM TRI, or 50 μM DCVC. Cells from the three pretreatment groups were then incubated for 1, 2, or 4 h with either 0, 0.25, 1, or 5 μM HgCl2. LDH activity was measured in media and in cells solubilized with 0.1% (v/v) Triton X-100. Results are means ± SE of measurements from 3 separate cell cultures. *Significantly different (P < 0.05) from corresponding samples preincubated with media.
Figure 11
Figure 11. Effects of pretreatment of primary cultures of hPT cells with TRI or DCVC on Hg2+-induced apoptosis
Confluent, hPT cell cultures were pretreated for 24 h with either media (= Control), 1 mM TRI, or 50 μM DCVC. Cells from the three pretreatment groups were then incubated for 1, 2, or 4 h with either 0, 0.25, 1, or 5 μM HgCl2. Cells were analyzed for apoptosis by flow cytometry as described in the legend to Fig. 8. Results are means ± SE of measurements from 3 separate cell cultures. *Significantly different (P < 0.05) from corresponding samples preincubated with media.

References

    1. Agency for Toxic Substances and Disease Registry (ATSDR) Toxicological profile for mercury. U.S. Department of Health and Human Services, Public Health Service; Atlanta, GA: 1999.
    1. Baggett JM, Berndt WO. The effect of depletion of nonprotein sulfhydryls by diethyl maleate plus buthionine sulfoximine on renal uptake of mercury in the rat. Toxicol. Appl. Pharmacol. 1986;83:556–562. - PubMed
    1. Berndt WO, Baggett JM, Blacker A, Houser M. Renal glutathione and mercury uptake by kidney. Fund. Appl. Toxicol. 1985;5:832–839. - PubMed
    1. Burton CA, Hatlelid K, Divine K, Carter DE, Fernando Q, Brendel K, Gandolfi AJ. Glutathione effects on toxicity and uptake of mercuric chloride and sodium arsenite in rabbit renal cortical slices. Environ. Health Perspec. 1995;103:81–84. - PMC - PubMed
    1. Carpenter DO, Arcaro KF, Bush B, Niemi WD, Pang S, Vakharia DD. Human health and chemical mixtures: An overview. Environ. Health Perspec. 1998;106(Suppl 6):1263–1270. - PMC - PubMed

Publication types

MeSH terms