Review
. 2007 May-Jun;94(1-2):144-68.
doi: 10.1016/j.pbiomolbio.2007.03.014. Epub 2007 Mar 24.

Influence of anisotropic conduction properties in the propagation of the cardiac action potential

Affiliations
Review

Influence of anisotropic conduction properties in the propagation of the cardiac action potential

Miguel Valderrábano. Prog Biophys Mol Biol. 2007 May-Jun.

Abstract

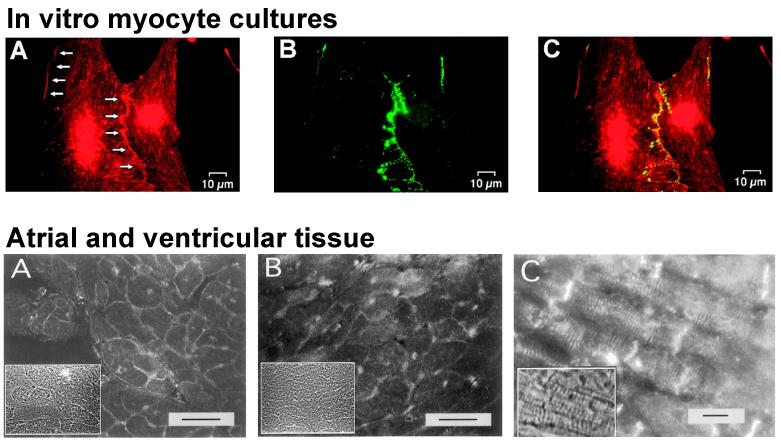
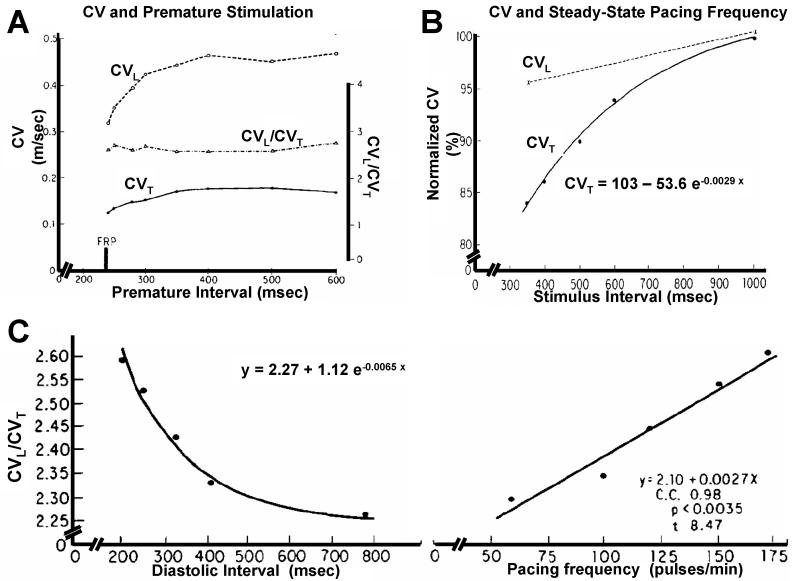
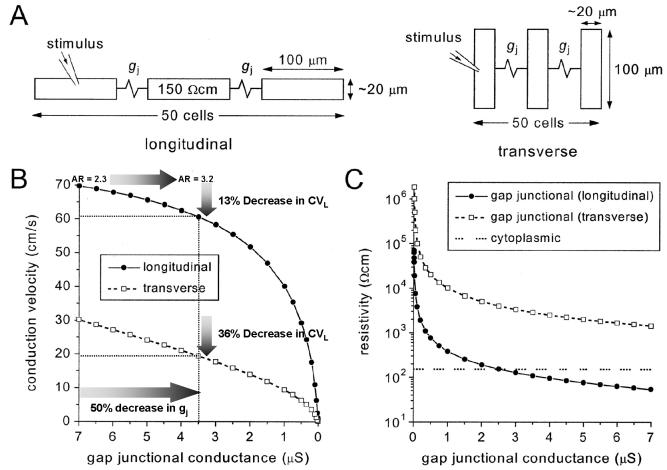
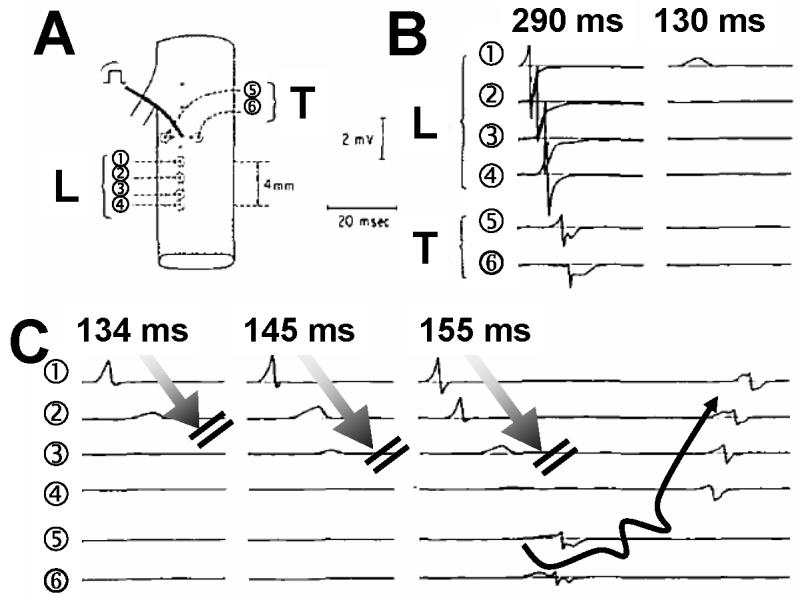
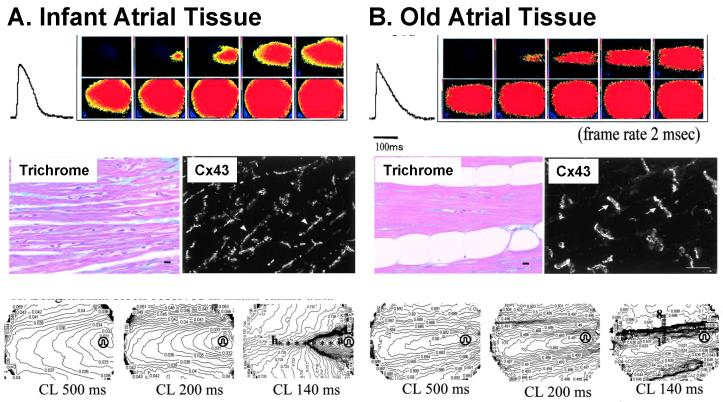
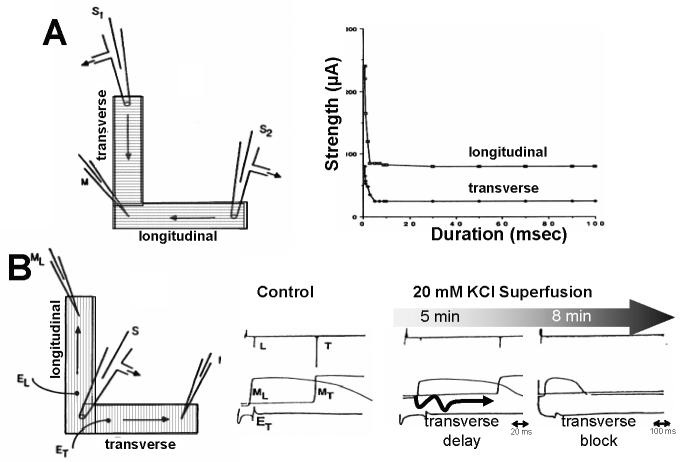
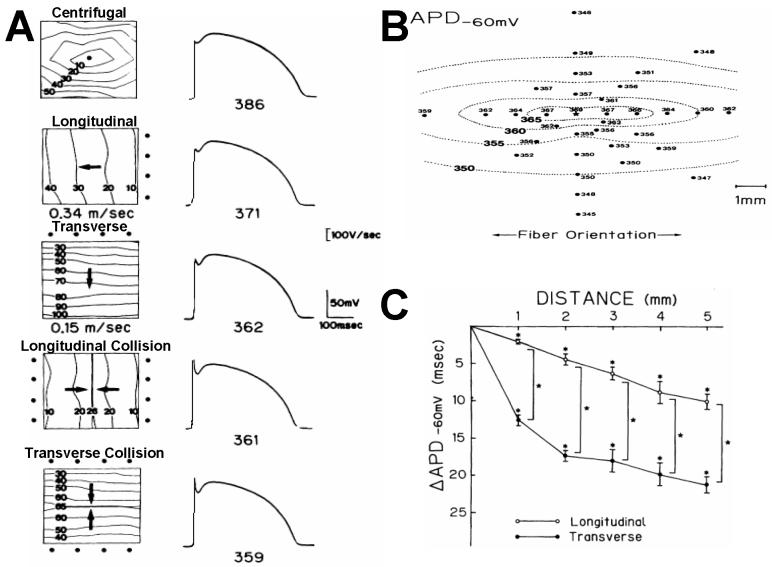
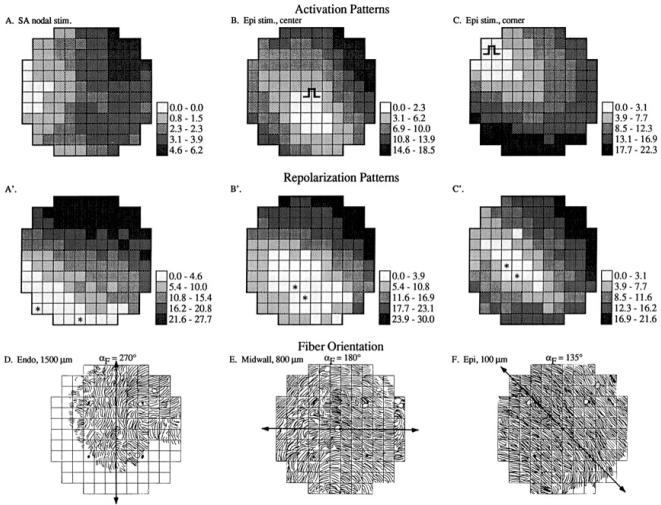
Anisotropy, the property of being directionally dependent, is ubiquitous in nature. Propagation of the electrical impulse in cardiac tissue is anisotropic, a property that is determined by molecular, cellular, and histological determinants. The properties and spatial arrangement of connexin molecules, the cell size and geometry, and the fiber orientation and arrangement are examples of structural determinants of anisotropy. Anisotropy is not a static property but is subject to dynamic functional regulation, mediated by modulation of gap junctional conductance. Tissue repolarization is also anisotropic. The relevance of anisotropy extends beyond normal propagation and has important implications in pathological states, as a potential substrate for abnormal rhythms and reentry.


Figures

Figure 1
Figure 1
Impulse propagation in one-dimensional cell chain (A through D) and 2-dimensional sheets (E through H). A, Schematic of the cell chain and the recording sites. Sites 1 and 2 are in the same cell. Site 3 is in the adjacent cell. Arrow indicates direction of propagation. B, top shows the upstroke of the actiion potential (optically measured) and bottom shows the first derivative. Sites 1 and 2 activate closer in time (simultaneous peak derivative, cytoplasmic conduction time of 30 μs). Site 3 activates after a delay (junctinal conduction time of 110 μs). C, Histograms of cytoplasmic (top) and junctional (bottom) conduction times. D, Fluorescent image of the cell chain. EH, Similar set of schematic (E), tracings (F), histograms (G) and fluorescent image for 2-D sheet. In 2-D, differences between cytoplasmic and junctional conduction times are less pronounced. (Fast and Kleber, 1993)
Figure 2
Figure 2
Increase in intercellular conduction delay with decrease in gap junction conductance. Action potential upstrokes from the edge elements (see inset) of two adjoining cells for intercellular conductance of 2.5 μs (A) and intercellular conductance of 0.25 μs (B). For control coupling (A), intercellular conduction delay is approximately equal to intracellular conduction time. A 10-fold decrease in intercellular conductance (B) increases intercellular conduction time and decreases intracellular conduction time dramatically, resulting in gap junction dominance of overall conduction velocity. (Shaw and Rudy, 1997)
Figure 3
Figure 3
A, Connexin43 distribution in relation to the cardiac myocyte surface in normal adult (top) and neonatal (bottom) canine left ventricular muscle. Gap junctions (green or yellow) were labeled with antibodies to connexin43. The sarcolemma (red), was labeled with wheat germ agglutinin. Bar=50 μm.. B, Action potential upstroke velocities (Vmax) in logitudinal vs transverse propagation in neonate vs adult preparations. Transverse Vmax increases with age. No directional dependence is seen in neonates.(Spach et al., 2000)
Figure 4
Figure 4
Relation of cell-to-cell delays (A) and peak upstroke velocities (dV/dtmax in B) with respect to cell size and the distribution of the gap junctions. All data is from transverse conduction. Below each graph, the drawings of single cells represent each cellular network: a and d indicate adult and neonatal cellular networks, respectively; b, hypothetical network with adult cell size scaling but with neonatal gap junction distribution; and c, hypothetical network with neonatal cell size scaling but with adult gap junction distribution. Irrespective of gap junctional distribution, large cells have long intercellular delays and steep upstrokes compared to small cells. (Spach et al., 2000) as adapted in (Kleber and Rudy, 2004)
Figure 5
Figure 5
Na channel colocalization with connexin at the sites of intercellular junctions. Top, cultured myocytes: A shows Na channels, B shows connexin 43, and C is a merged image. (Kucera et al., 2002) Bottom, immunolabeling of Na channel in transverse sections of atrial tissue (A), ventricular tissue (B) and longitudinal section of ventricular tissue. Insets are corresponding phase contrast images. Bar = 10 μm. (Cohen, 1996)
Figure 6
Figure 6
Functional modulation of anisotropy. A, response of CV to premature stimulation. CVL and CVT decrease proportionally so that the is not significant change in anisotropy ratio (CVL/CVT). B, response to increasing steady-state pacing frequency. Small changes of CVL in the presence of an exponential decay of CVT. C, steady state increases in CVL/CVT as a function diastolic interval (left) or pacing frequency (right).(Spach et al., 1982a)
Figure 7
Figure 7
Simulations of the effect of gap junctional conductance (gj) on conduction velocity. A, arrangement of the simulated longitudinal (left) and transverse (right) cable of cells. B, directional changes in CV as a function of gj. A 50% decrease in gj leads to a greater decrease in CVT than CVL, and to an increase in anisotropy ratio (AR). C, effective resistivity as a function of gj in both directions.(Jongsma and Wilders, 2000)
Figure 8
Figure 8
Induction of anisotropic reentry in an atrial pectinate muscle. A, schematic of the tissue with pacing site and recording electrode arrangement. Electrodes 1-4 record longitudinal (L) propagation, and 5-6 transverse(T) propagation. B, propagation during premature stimulation. At a long (290 ms) coupling interval, both longitudinal and transverse propagation succeed. At the refractory period (130 ms), both fail. C, propagation is decremental with block in the longitudinal direction (shaded arrows) at short coupling intervals (134, 145 ms) and fails in the transverse direction. At 155 ms coupling interval, decremental conduction and block occur in the longitudinal direction with preserved transverse conduction and reentry (curved arrow) (Spach et al., 1981).
Figure 9
Figure 9
Age-dependent changes in safety factor. A. Infant atrial tissue. Sequential propagation maps and action potential shape (top) show elliptical anisotropic propagation pattern. Homogenous fiber architecture (trichrome stain) and and diffuse connexin 43 (Cx43) expression are seen microscopically. (Middle panels). Isochronal propagation maps (1 ms isochrones) at different steady-state pacing cycle lengths (CL) shows longitudinal conduction block. B. Old atrial tissue shows a rectangular propagation pattern with enhanced anisotropy. Interposed fatty tissue between muscle fibers, polarized Cx43 distribution, and conduction block in the transverse direction. (Koura et al., 2002)
Figure 10
Figure 10
Anisotropy, excitability and safety factor. A, using an L-shaped preparation, pacing was performed on either limb (one with transverse conduction, S1, and the other with longitudinal conduction, S2). Succesful conduction was verified by recording propagated potentials at the junction of both limbs (M). Current thresholds (right) in the strength-duration curve were consistently higher for longitudinal propagation. B, To test safety factor, the junction of both L-limbs was paced and membrane potentials were measured at the end of the transverse (MT) or the longitudinal (ML) limb. Control showed the expected time delay in MT, upon superfusion with 20 mM KCl, transverse delay occurred (5 min), followed by transverse block (8 min). (Delgado et al., 1990).
Figure 11
Figure 11
Directional changes in action potential duration (APD). A, APD measurement in different propagation directions. Centrifugal (ellipsoid propagation generates the longest APD, followed by longitudinal, and transverse. APDs at collision sites are shortest. B, Spatial gradients of APD around point stimulation site. Gradient aligns with fiber orientation. C, APD gradients in the transverse and longitudinal direction. Transverse gradient are steeper.(Osaka et al., 1987).
Figure 12
Figure 12
Anisotropic repolarization sequence in guinea pig hearts. Top row, depolarization sequences during right atrial pacing (A), or in the center (B) or corner (C) of the epicardial surface. A clear change in activation sequence is seen. Middle row. Repolarization sequence corresponding to the different pacing sites. Lower row, fiber orientations in the endocardium (D), midwall (E), and epicardium (F). Repolarization sequences are remarkably similar to each other and have an elliptical shape, elongated along the orientation of epicardial fibers (lower row, right).(Kanai and Salama, 1995)
Figure 13
Figure 13
Nonuniform anisotropy and anisotropic reentry. A, normal and premature stimulation propagation patterns with or without nonuniform anisotropy. Numbers in msec are coupling intervals. In uniform anisotropy, premature stimulation does not alter propagation sequence. In nonuniform anisotropy, premature stimulation can lead to decremental longitudinal conduction and block, with zigzag transverse conduction (middle panel), or to zigzag conduction in both directions (lower panel). B, in nonuniform anisotropy with baseline propagation characterized by zigzag transverse conduction (left schematic and tracings), reentry can be induced by premature stimulation, in this case associated with transverse block, longitudinal zigzag conduction and retrograde activation, opposite to the case of uniform anisotropy shown in Figure 8. (Spach et al., 1988)
Figure 14
Figure 14
Trichrome stain of a swine left ventricular wall at the insertion of the papillary muscle. Note different fiber orientations, the vessels, and clefts in between fibers. From the author's file.
Figure 15
Figure 15
Fiber orientation transitions and reentry. A, schematic of the preparation and electrode position. The crista terminalis (longitudinal conduction) was apposed to the limbus (transverse conduction). B, local activation times with increasing prematurity. With decreasing coupling interval, delays in conduction toward the limbus (sites 3L, 4 and 5) occur, with a jump (at 270 ms) and induction of reentry. C, Propagation patterns across the transition. Site 3 detects both activations from the crista (3C) and the limbus (3L). Progressive delays between the two components is seen. At 220 ms coupling interval, there is unidirectional longitudinal block at site 3C and retrograde conduction with reentry.(Spach et al., 1982b)
Figure 16
Figure 16
Anisotropic cultured myocyte model. A, Patterned cultures can generate different fiber orientations in different portions of the culture, as shown with actin staining, which have anistropic conduction (Bursac et al., 2002). B, Stable spiral wave anchored at the transition of fiber orientations (schematic in the right). Note the different wavelength of the spiral in the different directions (green arrows), and the different local conduction velocities in the isochronal map.
Figure 17
Figure 17
Anisotropy during fibrillation. A, maps of cross-correlation of activations in 4 different sites (stars). A gradient (from high to low) is seen that is elongated along fiber orientation (arrow). (Choi et al., 2003) B, transient transmural reentry during fibrillation anchored to a transition of fiber orientation. (Valderrabano et al., 2001)
Figure 18
Figure 18
Effects of ischemia in tissue coupling and their correlation with gap junction changes. A, time course of tissue uncoupling during ischemia. B, changes in total Cx43 (rabbit polyclonal) and dephosphorylated Cx43 (mouse monoclonal). With progressive ischemia, total Cx43 appears to decrease, whereas dephosphorylated Cx43 increases. Total Cx43 does not actually decrease, but rather is internalized.(Beardslee et al., 2000)
Figure 19
Figure 19
Connexin distribution changes heart disease. A. Cx43 disarray in the periinfacrt border zone. Near the necrotic infarct there is lateralization of Cx43 as shown in fluorescent imaging, in contrast with normal polarized distribution of normal tissue (upper portion). (Peters et al., 1997) B. Cx43 lateralization in nonischemic, pacing-induced heart failure (HF), is a diffuse process. (Akar et al., 2004)

Similar articles

Cited by

References

    1. Abildskov JA. Effects of activation sequence on the local recovery of ventricular excitability in the dog. Circ Res. 1976;38:240–3. - PubMed
    1. Akar FG, Spragg DD, Tunin RS, Kass DA, Tomaselli GF. Mechanisms underlying conduction slowing and arrhythmogenesis in nonischemic dilated cardiomyopathy. Circ Res. 2004;95:717–25. - PubMed
    1. Akar FG, Tomaselli GF. Conduction abnormalities in nonischemic dilated cardiomyopathy: basic mechanisms and arrhythmic consequences. Trends Cardiovasc Med. 2005;15:259–64. - PubMed
    1. Allessie MA, Bonke FI, Schopman FJ. Circus movement in rabbit atrial muscle as a mechanism of tachycardia. II. The role of nonuniform recovery of excitability in the occurrence of unidirectional block, as studied with multiple microelectrodes. Circ Res. 1976;39:168–77. - PubMed
    1. Allessie MA, Bonke FI, Schopman FJ. Circus movement in rabbit atrial muscle as a mechanism of tachycardia. III. The “leading circle” concept: a new model of circus movement in cardiac tissue without the involvement of an anatomical obstacle. Circ Res. 1977;41:9–18. - PubMed