. 2007 Jun;50(7-8):921-31.
doi: 10.1016/j.neuint.2007.03.010. Epub 2007 Apr 7.

Responses of the mitochondrial alpha-ketoglutarate dehydrogenase complex to thiamine deficiency may contribute to regional selective vulnerability

Affiliations

Responses of the mitochondrial alpha-ketoglutarate dehydrogenase complex to thiamine deficiency may contribute to regional selective vulnerability

Q Shi et al. Neurochem Int. 2007 Jun.

Abstract

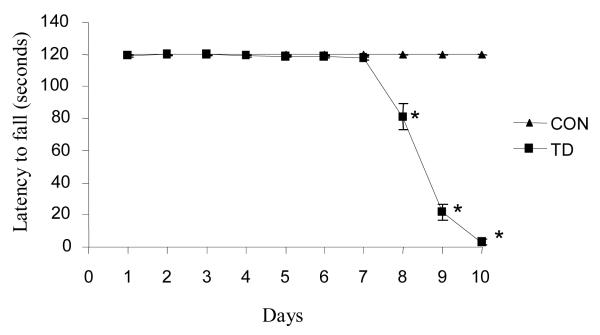
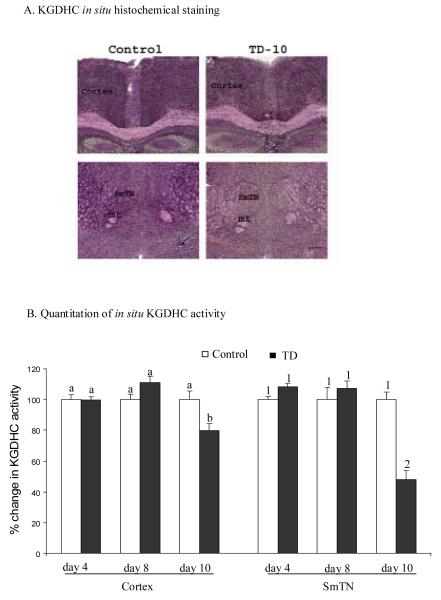
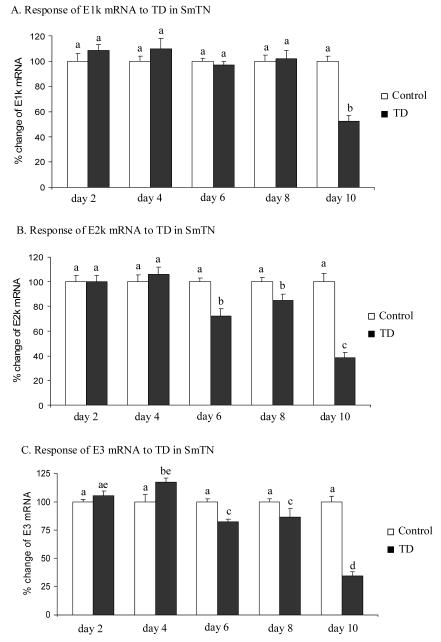
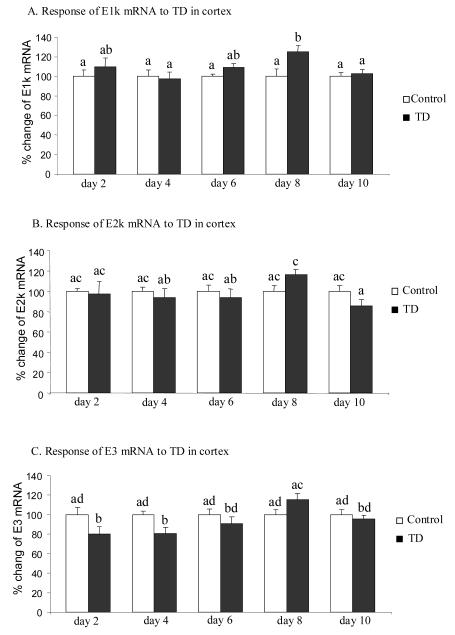
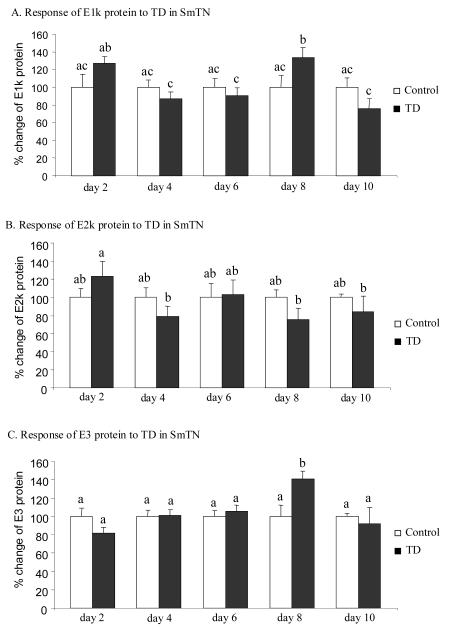
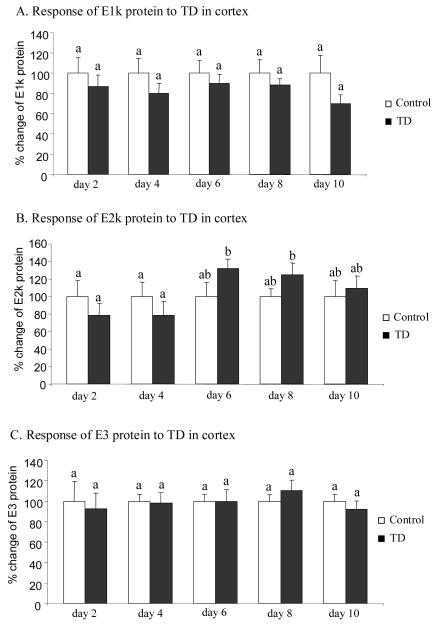
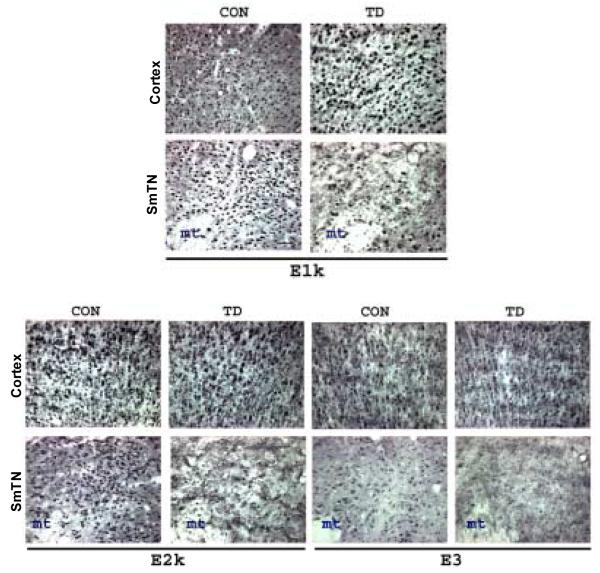
Thiamine-dependent enzymes are diminished in multiple neurodegenerative diseases. Thiamine deficiency (TD) reduces the activity of thiamine dependent-enzymes [e.g., the alpha-ketoglutarate dehydrogenase complex (KGDHC)], induces regional selective neurodegeneration and serves as a model of a mild impairment of oxidative metabolism. The current experiments tested whether changes in KGDHC protein subunits (E1k, E2k and E3) or activity or message levels underlie the selective loss of neurons in particular brain regions. Thus, TD-induced changes in these variables in the brain region most vulnerable to TD [the sub-medial thalamic nucleus (SmTN)] were compared to those in a region that is relatively resistant to TD (cortex) at stages of TD when the neuron loss in SmTN is not present, minimal or severe. Impaired motor performance on rotarod was apparent by 8 days of TD (-32%) and was severe by 10 days of TD (-97%). At TD10, the overall KGDHC activity measured by an in situ histochemical staining method declined 52% in SmTN but only 20% in cortex. Reductions in the E2k and E3 mRNA in SmTN occurred as early as TD6 (-28 and -18%, respectively) and were more severe by TD10 (-61 and -66%, respectively). On the other hand, the level of E1k mRNA did not decline in SmTN until TD10 (-48%). In contrast, TD did not alter mRNA levels of the subunits in cortex at late stages. Western blots and immunocytochemistry revealed different aspects of the changes in protein levels. In SmTN, the immunoreactivity of E1k and E3 by Western blotting increased 34 and 40%, respectively, only at TD8. In cortex, the immunoreactivity of the three subunits was not altered. Immunocytochemical staining of brain sections from TD10 mice indicated a reduction in the immunoreactivity of all subunits in SmTN, but not in cortex. These findings demonstrate that the response of the KGDHC activity, mRNA and immunoreactivity of E1k, E2k and E3 to TD is region and time dependent. Loss of KGDHC activity in cortex is likely related to post-translational modification rather than a loss of protein, whereas in SmTN transcriptional and post-translational modifications may account for diminished KGDHC activity. Moreover, the earlier detection in TD induced-changes of the transcripts of KGDHC indicates that transcriptional modification of the two subunits (E2k and E3) of KGDHC may be one of the early events in the cascade leading to selective neuronal death.


Figures

Figure 1
Figure 1
TD impaired rotarod performance from day 8. Control and TD mice were tested daily from day 1 to 10 on an accelerating rotarod with speed ranged from 6, 12, 18, 24 and 30 rpm for a maximum of 120 seconds. Motor performance was significantly reduced by 8-10 days of TD. The mean ± SEM represents the latency to fall. *p ≤ 0.05 as compared to control group (n = 8) [treatment (df = 1, F = 686.433); time (df = 9, F = 196.810)].
Figure 2
Figure 2
In situ KGDHC activity in SmTN and cortex of animals from control and thiamine deficient groups after different periods of treatment. KGDHC activity was measured by an in situ histochemistry activity stain at 4, 8 and 10 days of TD. Values were assessed as density over a blank without Co-A and α-ketoglutarate. The change in the density of TD group compared to control group was presented as the % change in KGDHC activity. A. representative sections showing in situ KGDHC activity staining after a 30 min incubation. Scale bar in lower right corner 200 μm. B. quantitation of in situ KGDHC activity. Regions of interest (cortex and SmTN) are indicated in panel A. Values in panel B represent means ± SEM of % change in KGDHC activity from at least three independent experiments in quadruplicate. Values with different letters or numbers vary significantly from each other (P<0.05) [cortex: treatment (df = 1, F = 0.81); time (df = 2, F = 6.830). SmTN: treatment (df = 1, F = 7.758); time (df = 2, F = 21.022)].
Figure 3
Figure 3
Temporal response of gene expression of KGDHC subunits E1k, E2k and E3 to TD in SmTN. Micropunches from SmTN were subjected to quantitative real-time RT-PCR to assess TD-induced changes in the gene expression of E1k (A), E2k (B) and E3 (C). mRNA for β-2-microglobulin (β2m) was measured in the same sample in parallel as an internal control. Values in panels A, B and C are the means ± SEM of percent changes over controls from four independent experiments done in triplicate after normalization to β2m. Values with different letters vary statistically from each other (P<0.05) [E1k: treatment (df = 1, F = 4.986); time (df = 4, F = 7.426). E2k: treatment (df = 1, F = 38.868); time (df = 4, F = 13.822). E3: treatment (df = 1, F = 28.698); time (df = 4, F = 26.565)].
Figure 4
Figure 4
Temporal response of gene expression of KGDHC subunits E1k, E2k and E3 to TD in cortex. Micropunches from cortex were subjected to quantitative real-time RT-PCR to assess TD-induced changes in the gene expression of E1k (A), E2k (B) and E3 (C). mRNA of β-microglobulin (β2m) used as an internal control was measured from the same sample in parallel. Values in panels A, B and C are the means ± SEM of percent changes over controls from four independent experiments done in triplicate after normalization to β2m. Values with different letters vary statistically from each other (P<0.05) [E1k: treatment (df = 1, F = 5.024); time (df = 4, F = 1.491). E2k: treatment (df = 1, F = 0.33); time (df = 4, F = 1.291). E3: treatment (df = 1, F = 28.698); time (df = 4, F = 26.565)].
Figure 5
Figure 5
Temporal response of immunoreactivity of the three subunits of KGDHC to TD in SmTN. Total protein was isolated from micropunches obtained from the SmTN and subjected to SDS-PAGE followed by Western blotting probed with antibodies against E1k (A), E2k (B) or E3 (C). β-actin immunoreactivity was used as an internal control. Values are means ± SEM of relative densities of the subunit from four independent experiments after normalization to β-actin. Values with different letters vary significantly from each other (P<0.05) [E1k: treatment (df = 1, F = 0.186); time (df = 4, F = 3.034). E2k: treatment (df = 1, F = 0.734); time (df = 4, F = 1.233). E3: treatment (df = 1, F = 0.470); time (df = 4, F = 3.055)].
Figure 6
Figure 6
Temporal response of immunoreactivity of the three subunits of KGDHC to TD in cortex. Total proteins isolated from micropunches from cortex were subjected to SDS-PAGE, Western blotting followed by immunodetection with antibody against E1k (A), E2k (B) or E3 (C). Values are means ± SEM of relative densities of the subunit from four independent experiments after normalization to β-actin. Values with different letters vary significantly from each other (P<0.05) [E1k: treatment (df = 1, F = 4.080); time (df = 4, F = 0.113). E2k: treatment (df = 1, F = 0.007); time (df = 4, F = 1.422). E3: treatment (df = 1, F = 0.036); time (df = 4, F = 0.235)].
Figure 7
Figure 7
Ten days of TD diminished immunoreactivity of KGDHC subunits only in SmTN as determined by immunocytochemistry. Representative photomicrographs from cortex and SmTN stained with antibodies specific against KGDHC subunits E1k, E2k and E3. TD brains show decrease in E1k, E2k and E3-immunoreactivity in SmTN compared to control, while the cortex was spared. Scale bar 50 μm.

Similar articles

Cited by

References

    1. Albers DS, Augood SJ, Park LC, Browne SE, Martin DM, Adamson J, Hutton M, Standaert DG, Vonsattel JP, Gibson GE, Beal MF. Frontal lobe dysfunction in progressive supranuclear palsy: evidence for oxidative stress and mitochondrial impairment. J Neurochem. 2000;74:878–81. - PubMed
    1. Barclay LL, Gibson GE, Blass JP. Impairment of behavior and acetylcholine metabolism in thiamine deficiency. J Pharmacol Exp Ther. 1981;217:537–43. - PubMed
    1. Barlow C, Hirotsune S, Paylor R, Liyanage M, Eckhaus M, Collins F, Shiloh Y, Crawley JN, Ried T, Tagle D, Wynshaw-Boris A. Atm-deficient mice: a paradigm of ataxia telangiectasia. Cell. 1996;86:159–71. - PubMed
    1. Bubber P, Ke ZJ, Gibson GE. Tricarboxylic acid cycle enzymes following thiamine deficiency. Neurochem. Int. 2004;45:1021–8. - PubMed
    1. Butterworth RF, Giguere JF, Besnard AM. Activities of thiamine-dependent enzymes in two experimental models of thiamine-deficiency encephalopathy. 2. alpha-Ketoglutarate dehydrogenase. Neurochem. Res. 1986;11:567–77. - PubMed

Publication types