. 2007 Jun;32(5):516-31.
doi: 10.1016/j.psyneuen.2007.03.005. Epub 2007 May 4.

Lipopolysaccharide induces delayed FosB/DeltaFosB immunostaining within the mouse extended amygdala, hippocampus and hypothalamus, that parallel the expression of depressive-like behavior

Affiliations

Lipopolysaccharide induces delayed FosB/DeltaFosB immunostaining within the mouse extended amygdala, hippocampus and hypothalamus, that parallel the expression of depressive-like behavior

François Frenois et al. Psychoneuroendocrinology. 2007 Jun.

Abstract

Proinflammatory cytokines induce both sickness behavior and depression, but their respective neurobiological correlates are still poorly understood. The aim of the present study was therefore to identify in mice the neural substrates of sickness and depressive-like behavior induced by lipopolysaccharide (LPS, 830 microg/kg, intraperitoneal). LPS-induced depressive-like behavior was dissociated from LPS-induced sickness by testing mice either at 6 h (at which time sickness was expected to be maximal) or at 24 h post-LPS (at which time sickness was expected to be minimal and not to bias the measurement of depressive-like behavior). Concurrently, the expression of acute and chronic cellular reactivity markers (c-Fos and FosB/DeltaFosB, respectively) was mapped by immunohistochemistry at these two time points. In comparison to saline, LPS decreased motor activity in a new cage at 6 h but not at 24 h. In contrast, the duration of immobility in the tail suspension test was increased at both 6 and 24 h. This dissociation between decreased motor activity and depressive-like behavior was confirmed at 24 h post-LPS in the forced swim test. LPS also decreased sucrose consumption at 24 and 48 h, despite normal food and water consumption by that time. At 24 h post-LPS, LPS-induced depressive-like behavior was associated with a delayed cellular activity (as assessed by FosB/DeltaFosB immunostaining) in specific brain structures, particularly within the extended amygdala, hippocampus and hypothalamus, whereas c-Fos labeling was markedly decreased by that time in all the brain areas at 6 h post-LPS. These results provide the first evidence in favor of a functional dissociation between the brain structures that underlie cytokine-induced sickness behavior and cytokine-induced depressive-like behavior, and provide important cues about the neuroanatomical brain circuits through which cytokines could have an impact on affect.


Figures

Fig. 1
Fig. 1. Anatomical levels and cerebral structures analyzed for the expression of c-Fos and FosB/ΔFosB (adapted from: Paxinos & Franklin, 2001)
Rostro-caudal anatomical levels used for the analysis of the expression of c-Fos and FosB/ΔFosB and their distance from Bregma in mm. Thirty-one brain areas were semi-quantitatively analyzed: 1, lateral septum; 2, core part of the nucleus accumbens; 3, shell part of the nucleus accumbens; 4, medial preoptic area; 5, dorsal part of the bed nucleus of the stria terminalis; 6, ventral part of the bed nucleus of the stria terminalis; 7, median preoptic nucleus; 8, medial nucleus of the amygdala; 9, basomedial nucleus of the amygdala; 10, anterior cortical nucleus of the amygdala; 11, central nucleus of the amygdala; 12, basolateral nucleus of the amygdala; 13, paraventricular nucleus of the thalamus; 14, paraventricular nucleus of the hypothalamus; 15, periventricular nucleus of the hypothalamus; 16, supraoptic nucleus; 17, field CA1 of the hippocampus; 18, field CA2 of the hippocampus; 19, field CA3 of the hippocampus; 20, dentate gyrus; 21, retrochiasmatic part of the supraoptic nucleus; 22, dorsomedial hypothalamic nucleus; 23, arcuate nucleus; 24, lateral hypothalamic area; 25, ventral tegmental area; 26, periaqueductal gray; 27, locus coeruleus; 28, central gray pons; 29, anterior part of the nucleus tractus solitarius; 30, posterior part of the nucleus tractus solitarius; 31, area postrema. Abbreviations : LV, lateral ventricule;3V, third ventricule; D3V, dorsal part of the third ventricule; Aq, Sylvius aqueduct; 4V, fourth ventricule.
Figure 2
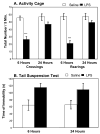
Figure 2. Depressive-like behavioral effects of LPS in the tail suspension test
Mice were injected i.p. with either saline (n = 12) or LPS (n = 12). Five and twenty-three hours later, motor activity was assessed by the total number of crossings and rearings performed in an activity cage (A). One hour later, mice were placed into the tail suspension test for 6 minutes and the duration of immobility was measured (B), Bars represent the mean + S.E.M. *** P<0.001 for the effect of treatment (LPS vs. saline).
Figure 3
Figure 3. Depressive-like behavioral effects of LPS in the forced swim test
Mice were injected i.p with either saline (n = 7) or LPS (n = 14). Twenty-three hours later, motor activity was assessed by the total number of crossings and rearings performed in the activity cage (A). One hour later, mice were placed into the forced swim test for 6 min and the durations of immobility, swimming and climbing were measured during the last 5 min of the test (B). Bars represent the mean ± SEM. ** P<0.01 for the effect of treatment (LPS vs. Saline).
Figure 4
Figure 4. Depressive-like behavioral effect of LPS in the sucrose preference test
Mice were injected i.p. with either saline or LPS and their relative sucrose intake, expressed as percent bodyweight, was measured overnight during 4 consecutive days post-LPS. Values represent the mean ± SEM of 10 mice/group. ** P<0.01; *** P<0.001 for the effect of treatment (LPS vs. Saline).
Figure 5
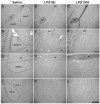
Figure 5. Photomicrographs illustrating LPS-induced c-Fos immunoreactivity within structures of the extended amygdala
The “saline” pictures where little or no c-Fos immunostaining was detected (A, D, G and J) are representative of saline-treated mice euthanized 6 hours after treatment. C-Fos immunolabeling was increased 6 hours after LPS treatment in the AcbS, BNSTd, BNSTv, CeA and BLA (B, E, H and K), but the expression of c-Fos decreased between 6 and 24 hours (C, F, I and L). Note also that in the Acb, c-Fos induction following LPS was restricted to the shell part and that in the BNSTd, LPS-induced c-Fos immunoreactivity was detected in the lateral and juxtacapsular parts. Abbreviations: ac, anterior commissure; LV, lateral ventricule. Scale bar: 300 μm.
Figure 6
Figure 6. LPS-induced c-Fos immunoreactivity within hypothalamic nuclei
The “saline” pictures where little or no c-Fos immunostaining was detected (A, D, G and J) are representative of saline-treated mice euthanized 6 hours after treatment. C-Fos immunoreactivity was increased 6 hours after LPS treatment in the Pe, PVN, SO, SOR and Arc (B, E, H and K), but decreased between 6 and 24 hours (C, F, I and L). Abbreviations: 3V, third ventricule; opt: optic tract. Scale bar: 300 μm.
Figure 7
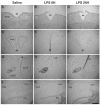
Figure 7. FosB/ΔFosB immunoreactivity in the NTSa, PVN, Acb and hippocampus
Basal levels of FosB/ΔFosB immunoreactivity were noticeably heterogeneous across the structures analyzed, as little or no FosB/ΔFosB immunostaining could be detected within the NTSa (A), PVN (D), and CA1 and CA2 (J), whereas a high basal staining level was detected within the Acb (G) and DG (J). In the brain structures with a low basal level [NTSa (B and C), PVN (E and F), and CA1 and CA2 (K and L)] as well as in the DG (K and L), LPS treatment induced a time-dependent increase of FosB/ΔFosB immunoreactivity with a maximum expression level at 24 hours after treatment. In contrast, in the Acb (H and I), FosB/ΔFosB expression was significantly increased only at 24 hours after LPS. Abbreviations: 3V, third ventricule; 4V, fourth ventricule; ac, anterior commissure; LV, lateral ventricule. Scale bar: 300 μm.

Similar articles

Cited by

References

    1. Alheid GF. Extended amygdala and basal forebrain. Ann NY Acad Sci. 2003;985:185–205. - PubMed
    1. Alheid GF, Heimer L. New perspectives in basal forebrain organization of special relevance for neuropsychiatric disorders: the striatopallidal, amygdaloid, and corticopetal components of substantia innominata. Neuroscience. 1988;27:1–39. - PubMed
    1. Alheid GF, Heimer L. Theories of basal forebrain organization and the “emotional motor system”. Prog Brain Res. 1996;107:461–484. - PubMed
    1. Allan SM, Rothwell NJ. Cytokines and acute neurodegeneration. Nat Rev Neurosci. 2001;2:734–744. - PubMed
    1. Anisman H, Kokkinidis L, Merali Z. Further evidence for the depressive effects of cytokines: anhedonia and neurochemical changes. Brain Behav Immun. 2002;16:544–556. - PubMed

Publication types