. 2007 May 4;129(3):605-16.
doi: 10.1016/j.cell.2007.02.047.

Intercellular coupling confers robustness against mutations in the SCN circadian clock network

Affiliations

Intercellular coupling confers robustness against mutations in the SCN circadian clock network

Andrew C Liu et al. Cell. .

Abstract

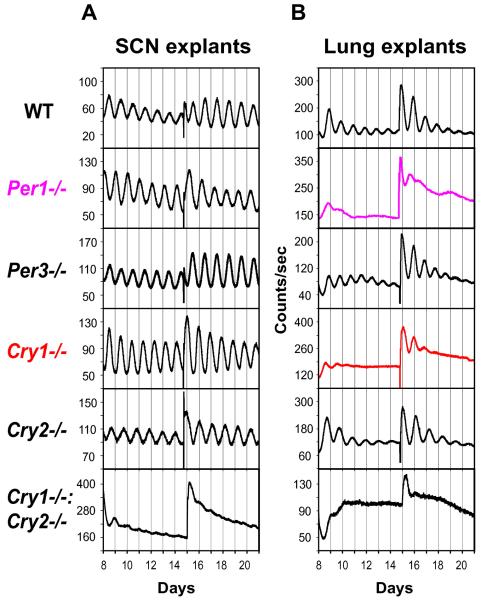
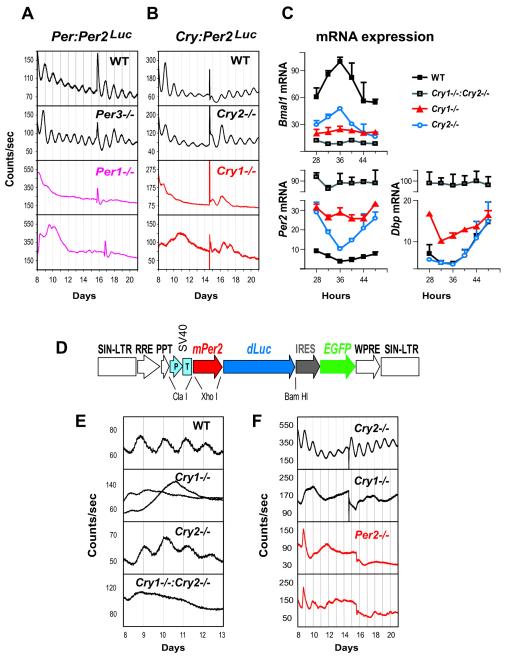
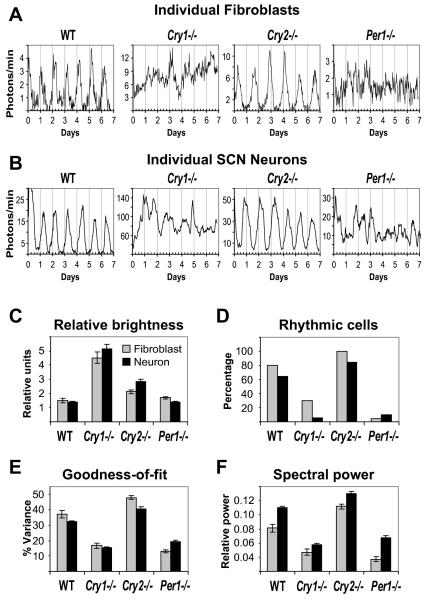
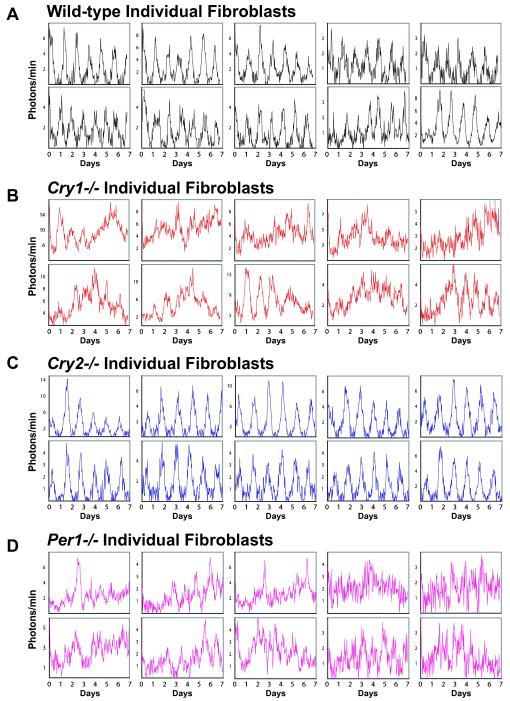
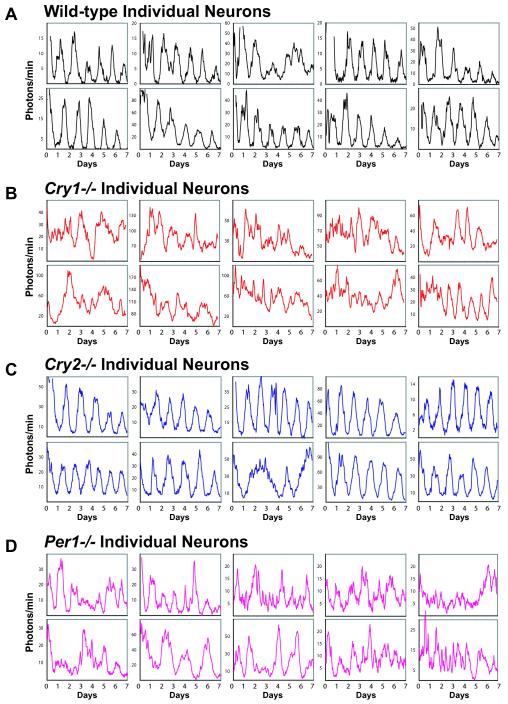
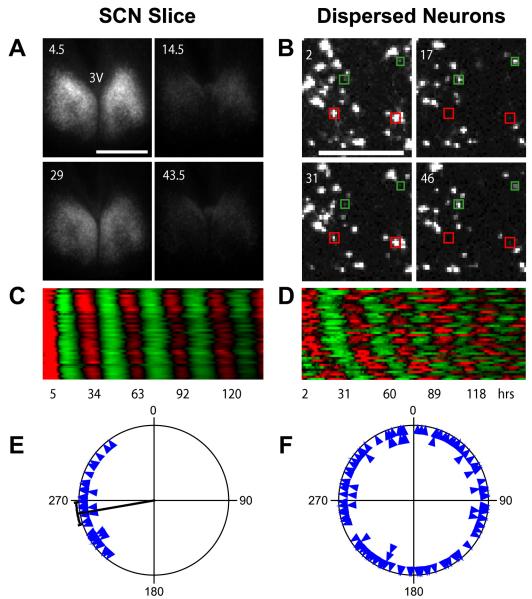
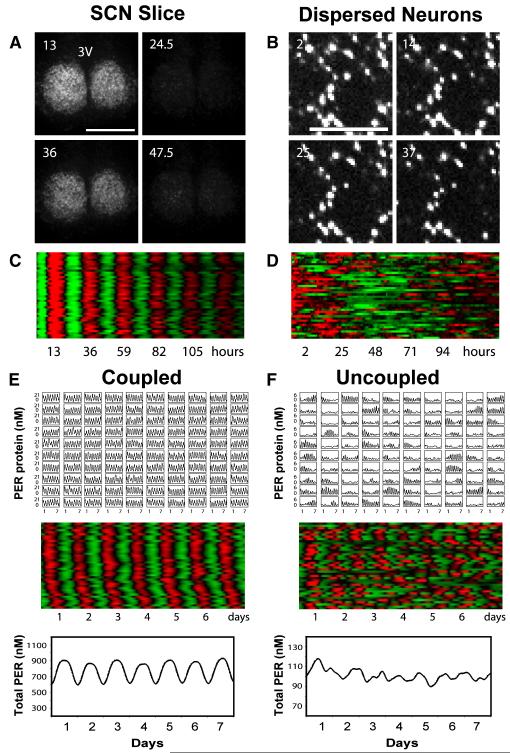
Molecular mechanisms of the mammalian circadian clock have been studied primarily by genetic perturbation and behavioral analysis. Here, we used bioluminescence imaging to monitor Per2 gene expression in tissues and cells from clock mutant mice. We discovered that Per1 and Cry1 are required for sustained rhythms in peripheral tissues and cells, and in neurons dissociated from the suprachiasmatic nuclei (SCN). Per2 is also required for sustained rhythms, whereas Cry2 and Per3 deficiencies cause only period length defects. However, oscillator network interactions in the SCN can compensate for Per1 or Cry1 deficiency, preserving sustained rhythmicity in mutant SCN slices and behavior. Thus, behavior does not necessarily reflect cell-autonomous clock phenotypes. Our studies reveal previously unappreciated requirements for Per1, Per2, and Cry1 in sustaining cellular circadian rhythmicity and demonstrate that SCN intercellular coupling is essential not only to synchronize component cellular oscillators but also for robustness against genetic perturbations.


Figures

Figure 1
Figure 1
Per1 and Cry1 Are Required for Sustained mPer2Luc Rhythms in Peripheral Tissue Explants. Representative records of tissue-autonomous mPer2Luc bioluminescence rhythms in SCN explants (A) and lung explants (B) from Per and Cry knockout mice. Tissue explants were dissected (day 0) and immediately cultured in explant medium (EM) for recording. Data are shown beginning immediately following a change to fresh EM (day 8); another medium change occurred at day 15.
Figure 2
Figure 2
Per1, Per2, and Cry1 Are Required for Sustained mPer2Luc Rhythms in Dissociated Fibroblasts (A and B) Representative records of mPer2Luc bioluminescence rhythms in populations of primary fibroblasts derived from Per1 and Per3 knockout mice (A) and Cry1 and Cry2 knockout mice (B). Cells were first grown to confluence and then changed to EM for recording (day 0). Data are shown beginning immediately following a change to fresh EM (day 8), and another medium change occurred near the middle of each record. Two traces are shown for Per1−/− and for Cry1−/− fibroblasts.(C) Temporal mRNA expression profiles of Per2, Dbp, and Bmal1 in immortalized fibroblasts. Expression was analyzed at 4 hr intervals by reverse transcription and quantitative PCR. Values are expressed as a percent of maximum expression for each gene. Error bars represent standard deviation (SD) of expression levels from two independent cell lines for each genotype. Each PCR reaction was repeated three times, and results were confirmed in two independent time courses.(D) Lentiviral mPer2-dLuc clock reporter construct. The vector contains the mouse Per2 promoter, the coding region dLuc, and an IRES-mediated EGFP coding sequence as detailed in Supplemental Data. This entire DNA cassette is flanked by the long terminal repeats (LTRs) of a lentiviral packaging vector.(E and F) Circadian bioluminescence recordings from primary fibroblasts (E) and immortalized fibroblasts (F) transduced with the mPer2-dLuc reporter. Two traces are shown for Per2−/− fibroblasts.
Figure 3
Figure 3
Per1 and Cry1 Are Required for Cell-Autonomous mPer2Luc Rhythms in Fibroblasts and SCN Neurons (A and B) Representative bioluminescence intensity patterns for fibroblasts (A) and SCN neurons (B) derived from WT, Cry1−/−, Cry2−/−, and Per1−/− mice. Imaging began immediately following a change to fresh EM (day 0). Most WT and Cry2−/− cells were rhythmic, while most Cry1−/− and Per1−/− cells were arrhythmic. See Figure 4 and Figure 5 for more individual cell rhythms.(C) Single-cell brightness comparisons across genotype. SCN neurons were brighter than fibroblasts. The relative unit of brightness was 6.6 photons/min for SCN neurons and 1 photon/min for fibroblasts. Values are presented as mean ± standard error of the mean (SEM).(D-F) Summary of single-cell analysis. Most individual WT and Cry2−/− fibroblasts and SCN neurons were rhythmic as determined using FFT spectral power, whereas most Per1−/− and Cry1−/− cells were either arrhythmic or showed weak or transient rhythms (D). Overall, Per1−/− and Cry1−/− cells had significantly reduced goodness-of-fit (E) and spectral power (FFT-RelPower; F), compared to WT and Cry2−/−. In (E) and (F), values are presented as mean ± SEM.
Figure 4
Figure 4
mPer2Luc Bioluminescence Patterns of Individual Fibroblasts Ten single-cell fibroblast rhythms representative of each genotype are presented for (A) WT, (B) Cry1−/−, (C) Cry2−/−, and (D) Per1−/−. Imaging began immediately following a change to fresh EM (day 0). These results show that both Cry1 and Per1 are required for sustained rhythmicity in the fibroblasts.
Figure 5
Figure 5
mPer2Luc Bioluminescence Patterns of Individual SCN Neurons Ten single SCN neuron rhythms representative of each genotype are presented for (A) WT, (B) Cry1−/−, (C) Cry2−/−, and (D) Per1−/−. Imaging began immediately following a change to fresh EM (day 0). These results show that both Cry1 and Per1 are required for sustained rhythmicity in SCN neurons. See Movies S1 and S2 for dynamic views of Cry2−/− and Cry1−/− neurons, respectively.
Figure 6
Figure 6
Network Interaction Synchronizes Cellular Oscillators in Cry2−/− SCN (A) Bioluminescence images of a Cry2−/− SCN slice culture at peak and trough phases, showing stable and synchronized oscillations. Numbers indicate hours after start of imaging. 3V indicates third ventricle. Scale bar is 500 μm.(B) Bioluminescence images of dissociated individual Cry2−/− SCN neurons showing cell-autonomous, desynchronized oscillations. Note that the cells highlighted with red and green are antiphasic. Numbers and scale bar are as in (A). See also Figure 5 and Movie S1.(C and D) Raster plots of bioluminescence intensity of individual Cry2−/− neurons in SCN slice in (A) and from dispersed culture in (B). Forty cells are presented in each plot, and each horizontal line represents a single cell. Values above and below the mean are shown in red and green, respectively.(E and F) Circadian phase plots of rhythmic Cry2−/− neurons within the SCN slice in (A) and from the dispersal culture in (B). Each blue triangle represents the phase of one cell at the end of a 6-7 day experiment, where 0° = phase of the fitted peak of the rhythm. The radial line indicates the average phase, and the arc indicates the 95% confidence interval for mean phase. Rayleigh test: p < 0.0001 (n = 40) for neurons in the SCN slice; p = 0.97 (n = 121) for dissociated neurons. Most dissociated Cry2−/− SCN neurons expressed rhythmic patterns of bioluminescence that were initially partly synchronized by medium change but then gradually desynchronized due to varying intrinsic periods in the absence of functional intercellular coupling (B, D, and F), whereas cells in the slice culture were synchronized across the SCN and throughout the course of the experiment (A, C, and E).
Figure 7
Figure 7
Bioluminescence Imaging and Mathematical Simulations Demonstrate that Intercellular Coupling Can Stabilize and Sustain Circadian mPer2Luc Rhythms in Cry1−/− SCN (A) Bioluminescence images of a representative Cry1−/− SCN slice culture at peak and trough phases, showing stable and synchronized bioluminescence oscillations. Numbers and scale bar are as in Figure 6.(B) Bioluminescence images of dissociated individual Cry1−/− SCN neurons showing cell-autonomous, largely arrhythmic patterns of high bioluminescence intensity. Numbers and scale bar are as in (A). See also Figure 5 and Movie S2.(C and D) Raster plots of bioluminescence intensity of individual Cry1−/− neurons in SCN slice in (A) and from dispersed culture in (B). Plots were constructed as in Figure 6. Dissociated Cry1−/− SCN neurons were largely arrhythmic, whereas cells in the slice culture were highly rhythmic and very tightly synchronized across the SCN.(E and F) Mathematical simulation for coupled oscillators (E) and uncoupled oscillators (F). Time courses of 100 oscillators (single-cell PER protein concentration in 10×10 grid, top), raster plots of 40 oscillators (middle), and the sum (total PER concentration for 100 oscillators, bottom) are presented for each condition.

References

    1. Aton SJ, Herzog ED. Come together, right...now: synchronization of rhythms in a mammalian circadian clock Neuron. 2005;48:531–534. - PMC - PubMed
    1. Aton SJ, Colwell CS, Harmar AJ, Waschek J, Herzog ED. Vasoactive intestinal polypeptide mediates circadian rhythmicity and synchrony in mammalian clock neurons. Nat. Neurosci. 2005;8:476–483. - PMC - PubMed
    1. Bae K, Jin XW, Maywood ES, Hastings MH, Reppert SM, Weaver DR. Differential functions of mPer1, mPer2, and mPer3 in the SCN circadian clock Neuron. 2001;30:525–536. - PubMed
    1. Balsalobre A, Damiola F, Schibler U. A serum shock induces circadian gene expression in mammalian tissue culture cells. Cell. 1998;93:929–937. - PubMed
    1. Brown SA, Fleury-Olela F, Nagoshi E, Hauser C, Juge C, Meier CA, Chicheportiche R, Dayer JM, Albrecht U, Schibler U. The period length of fibroblast circadian gene expression varies widely among human individuals. PLoS Biol. 2005;3:e338. - PMC - PubMed

Publication types

MeSH terms

LinkOut - more resources