. 2007 Sep 1;93(5):1758-67.
doi: 10.1529/biophysj.107.108209. Epub 2007 May 4.

Detecting ultraviolet damage in single DNA molecules by atomic force microscopy

Affiliations

Detecting ultraviolet damage in single DNA molecules by atomic force microscopy

Yong Jiang et al. Biophys J. .

Abstract

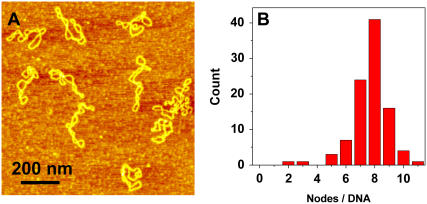
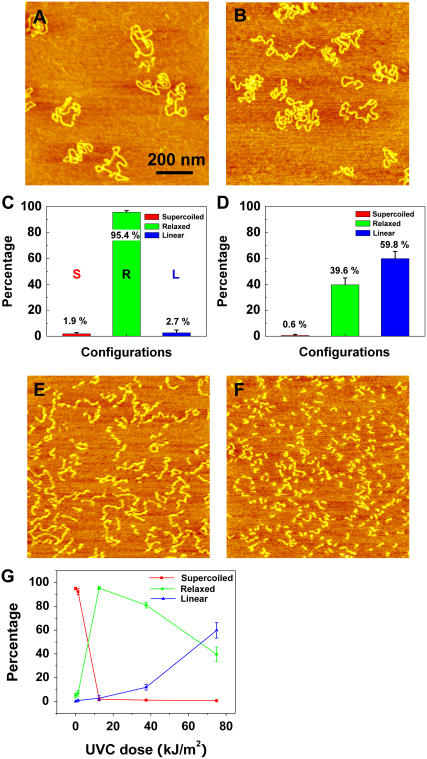
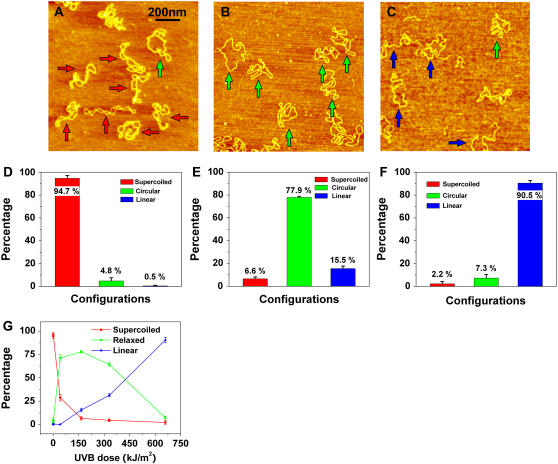
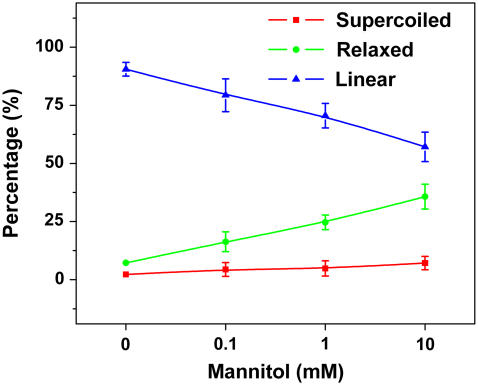
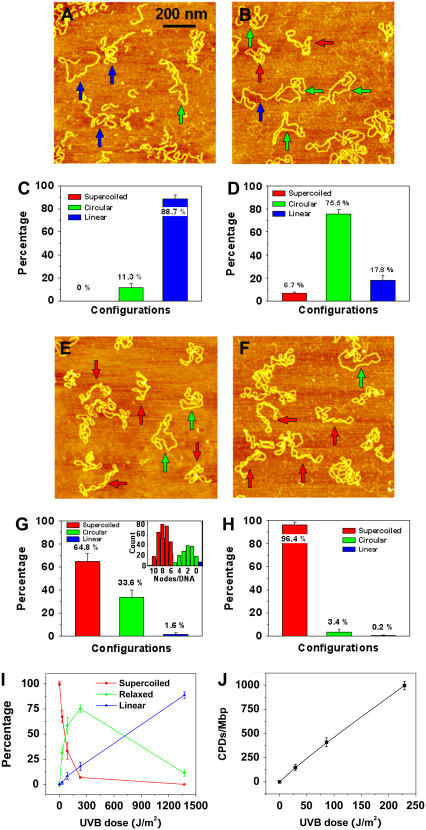
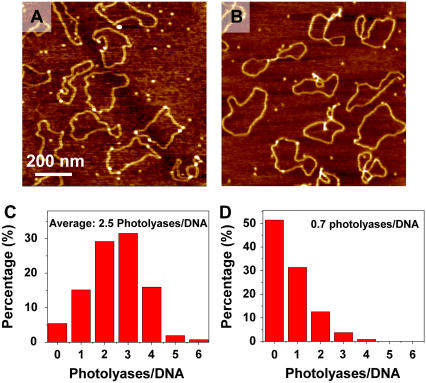
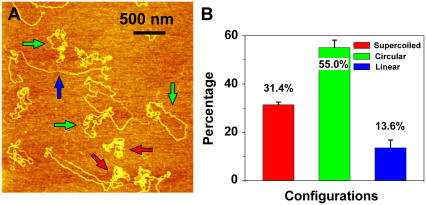
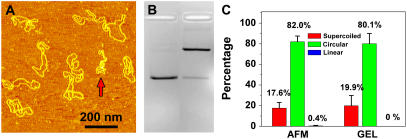
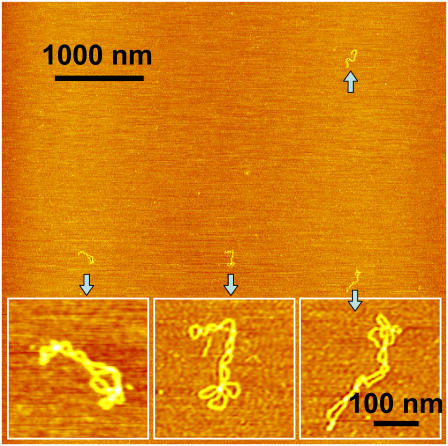
We report detection and quantification of ultraviolet (UV) damage in DNA at a single molecule level by atomic force microscopy (AFM). By combining the supercoiled plasmid relaxation assay with AFM imaging, we find that high doses of medium wave ultraviolet (UVB) and short wave ultraviolet (UVC) light not only produce cyclobutane pyrimidine dimers (CPDs) as reported but also cause significant DNA degradation. Specifically, 12.5 kJ/m(2) of UVC and 165 kJ/m(2) of UVB directly relax 95% and 78% of pUC18 supercoiled plasmids, respectively. We also use a novel combination of the supercoiled plasmid assay with T4 Endonuclease V treatment of irradiated plasmids and AFM imaging of their relaxation to detect damage caused by low UVB doses, which on average produced approximately 0.5 CPD per single plasmid. We find that at very low UVB doses, the relationship between the number of CPDs and UVB dose is almost linear, with 4.4 CPDs produced per Mbp per J/m(2) of UVB radiation. We verified these AFM results by agarose gel electrophoresis separation of UV-irradiated and T4 Endonuclease V treated plasmids. Our AFM and gel electrophoresis results are consistent with the previous result obtained using other traditional DNA damage detection methods. We also show that damage detection assay sensitivity increases with plasmid size. In addition, we used photolyase to mark the sites of UV lesions in supercoiled plasmids for detection and quantification by AFM, and these results were found to be consistent with the results obtained by the plasmid relaxation assay. Our results suggest that AFM can supplement traditional methods for high resolution measurements of UV damage to DNA.


Figures

FIGURE 1
FIGURE 1
AFM image of intact pUC18 plasmids reveal their supercoiled topology. (A) Tapping mode AFM image of pUC18 adsorbed to APS-mica surface. Scan size 1 × 1 μm2. (B) The frequency distribution of the number of supercoiled nodes in intact pUC18 plasmids (based on 21 AFM images).
FIGURE 2
FIGURE 2
AFM images of UVC-irradiated pUC18 molecules at different doses: (A) 12.5 kJ/m2, (B) 75 kJ/m2, (E) 150 kJ/m2, (F) 600 kJ/m2. C and D histograms count the various configurations of pUC18 molecules shown in A and B. Color code: red, supercoiled DNA; green, relaxed circular plasmids; blue, linear DNA “L”. The error bars in the figures represent standard deviation. Each histogram is based on 30–36 AFM images. (G) Percentages of different configurations of irradiated pUC18 as a function of UVC dose.
FIGURE 3
FIGURE 3
AFM images of pUC18 molecules subjected to different doses of UVB radiation: (A) 1.4 kJ/m2, (B) 165 kJ/m2, (C) 660 kJ/m2. Scan size in all the images is 1 × 1 μm2. (DF) Histograms of the occurrence of various configurations of pUC18 plasmids determined from the AFM images such as these shown in (AC). Color code and error bar are the same as in Fig. 2. Each histogram is based on 18–25 AFM images. (G) Percentages of different configurations of irradiated pUC18 as a function of UVB dose.
FIGURE 4
FIGURE 4
Percentage of pUC18 with different structures after 660 kJ/m2 UVB radiation as a function of the concentration of Mannitol.
FIGURE 5
FIGURE 5
AFM images of pUC18 molecules irradiated with different doses of UVB radiation and incubated with T4 Endonuclease V: (A) 1.4 kJ/m2-irradiated pUC18, (B) 229 J/m2-irradiated pUC18, (E) 29 J/m2-irradiated pUC18, and (F) intact pUC18 (control experiment). All scan sizes are 1 × 1 μm2. (C, D, G, H) Histograms of the occurrence of various configurations of pUC18 plasmids determined from AFM images such as these shown in (A, B, E, F). Color code and error bar are the same as in Fig. 2. Each histogram is based on 19–36 AFM images. (I) Percentages of different configurations of irradiated pUC18 as a function of UVB dose. (J) The number of CPDs per million basepairs as a function of UVB dose, supposing the distribution of CPDs follows Poisson.
FIGURE 6
FIGURE 6
AFM images show photolyases binding to the CPD sites of pUC18 with (A) 229 J/m2 UVB radiation, and (B) no UV as control. (C) and (D) Histograms show the distribution of photolyases on each pUC18 molecules as shown in A and B.
FIGURE 7
FIGURE 7
Sensitivity of damage detection increases with plasmid size. (A) An AFM image of supercoiled plasmid pNEBR-R1 (10,338 basepairs) irradiated at 29 J/m2 UVB. Scan size 3 × 3 μm2. (B) Percentages of different configurations of pNEBR-R1 plasmids determined from AFM images such as these shown in A. Color code is the same as in Fig. 2.
FIGURE 8
FIGURE 8
(A) AFM images of pUC18 molecules irradiated with 135 J/m2 UVB radiation and incubated with T4 Endonuclease V. (B) Agarose gel electrophoresis image: lane 1: control, and lane 2: the same sample as in Fig. 8 A. (C) Histograms compare the distributions obtained by AFM and gel electrophoresis as shown in A and B.
FIGURE 9
FIGURE 9
AFM image of intact pUC18 plasmids obtained from a sample that contained the total amount of 1 pg of DNA material. Scan size 5 × 5 μm2. The inset images obtained at a higher resolution show in detail the supercoiled structure of these plasmids. The scale bar for these inset images is 100 nm. The sample was prepared by spreading 0.1 μl of a 10 pg/μl solution of pUC18 on the APS-mica surface and incubating for 3 min. This assay requires extremely small amounts of DNA to evaluate damage.

References

    1. Friedberg, E. C., G. C. Walker, and W. Siede. 1995. DNA Repair and Mutagenesis. ASM Press, Washington, DC.
    1. Sinha, R. P., and D. P. Hader. 2002. UV-induced DNA damage and repair: a review. Photochem. Photobiol. Sci. 1:225–236. - PubMed
    1. Setlow, R. B., and W. L. Carrier. 1966. Pyrimidine dimers in ultraviolet-irradiated DNA's. J. Mol. Biol. 17:237–254. - PubMed
    1. Douki, T., A. Reynaud-Angelin, J. Cadet, and E. Sage. 2003. Bipyrimidine photoproducts rather than oxidative lesions are the main type of DNA damage involved in the genotoxic effect of solar UVA radiation. Biochemistry. 42:9221–9226. - PubMed
    1. Besaratinia, A., T. W. Synold, H.-H. Chen, C. Chang, B. Xi, A. D. Riggs, and G. P. Pfeifer. 2005. DNA lesions induced by UV A1 and B radiation in human cells: comparative analyses in the overall genome and in the p53 tumor suppressor gene. Proc. Natl. Acad. Sci. USA. 102:10058–10063. - PMC - PubMed

Publication types

MeSH terms