. 2007 May;19(5):1617-34.
doi: 10.1105/tpc.105.035626. Epub 2007 May 4.

Arabidopsis protein kinase PKS5 inhibits the plasma membrane H+ -ATPase by preventing interaction with 14-3-3 protein

Affiliations

Arabidopsis protein kinase PKS5 inhibits the plasma membrane H+ -ATPase by preventing interaction with 14-3-3 protein

Anja T Fuglsang et al. Plant Cell. 2007 May.

Abstract

Regulation of the trans-plasma membrane pH gradient is an important part of plant responses to several hormonal and environmental cues, including auxin, blue light, and fungal elicitors. However, little is known about the signaling components that mediate this regulation. Here, we report that an Arabidopsis thaliana Ser/Thr protein kinase, PKS5, is a negative regulator of the plasma membrane proton pump (PM H+ -ATPase). Loss-of-function pks5 mutant plants are more tolerant of high external pH due to extrusion of protons to the extracellular space. PKS5 phosphorylates the PM H+ -ATPase AHA2 at a novel site, Ser-931, in the C-terminal regulatory domain. Phosphorylation at this site inhibits interaction between the PM H+ -ATPase and an activating 14-3-3 protein in a yeast expression system. We show that PKS5 interacts with the calcium binding protein SCaBP1 and that high external pH can trigger an increase in the concentration of cytosolic-free calcium. These results suggest that PKS5 is part of a calcium-signaling pathway mediating PM H+ -ATPase regulation.


Figures

Figure 1.
Figure 1.
PKS5 RNAi Plants Are More Tolerant to High External pH. (A) PKS5 expression is silenced in the PKS5 RNAi lines. Products of RT-PCR using DNA from wild-type Arabidopsis, three independent PKS5 RNAi lines (pks5#6, pks5#7, and pks5#9), and PKS5-specific primers (top panel). Tubulin primers were included in the PCR reactions as an internal control. RT-PCR with PKS24 and PKS16 gene-specific primers (bottom panels). M, molecular size markers. (B) to (F) PKS5 RNAi line pks5#9 is more tolerant to high external pH during germination and growth. Wild-type and pks5#9 seeds were germinated on vertical MS agar plates at pH 5.8, 8.2, or 9.0. Ratios of seed germination over time as a percentage of the total number of seeds planted are shown for the different treatments ([B], means ± sd, n = 3). Four-day-old wild-type and pks5#9 seedlings, germinated on MS media at pH 5.8, were transferred (day 4) to MS media at pH 5.8 (C), 8.0 (D), 8.2 (E), or 8.4 (F). Images were taken 2 weeks after seedling transfer.
Figure 2.
Figure 2.
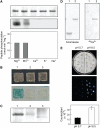
T-DNA Insertion and EMS pks5 Mutants Have a Similar Phenotype to That Found in the PKS5 RNAi Line. (A) and (B) Six-day-old wild-type and pks5 seedlings, germinated on MS media pH 5.8, were transferred to MS media at pH 5.8 ([A], left panel) and 8.4 ([A], center and right panels). All images were taken 2 weeks after seedling transfer. The positions of the T-DNA insertion (pks5-1) and the premature stop codon (pks5-2) are indicated ([B], top panel). RNA gel blot analysis showed that the PKS5 transcript was undetectable in the pks5-1 mutant ([B], middle panel). (C) Seedlings (4 d old) were transferred to plates buffered with Bicine to pH 8.2. Control plates were adjusted to pH 6.5 using the same buffer. Images were taken 3 d after seedling transfer.
Figure 3.
Figure 3.
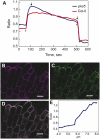
pH Ratio Imaging in the Apoplast of Columbia-0 and pks5-1 Roots. (A) Mean value ratio curve for mutant (n = 13) and wild-type (n = 10) plants. Ratios were calculated as fluorescein/rhodamin fluorescence levels. The slope in each experiment was calculated and used in one-way analysis of variance, which showed wild-type and mutant plants to react significantly differently on raised pH regimes. Asterisks show where pH regimes were shifted upwards to pH 8.4 and downwards to pH 5.8, respectively. Arrows indicate the two outer points used to define the area from where the slope was calculated. (B) Fluorescence in the fluorescein channel colored in pseudo color. (C) Fluorescence in the rhodamin channel colored in pseudo color. (D) Overlay of the fluorescein and rhodamin channels colored in pseudo colors. Bars = 20 μm in (B) to (D). (E) pH calibration curve showing the response of the probe D-1950 at different pH regimes.
Figure 4.
Figure 4.
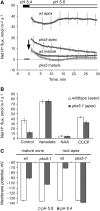
In Vivo Measurement of Net Proton Fluxes from Roots of pks5 and Wild-Type Plants. Noninvasive ion flux measurements (the MIFE) were used for in situ characterization of pks5 roots. Error bars represent means ± se of three replicate experiments. (A) Net proton fluxes in pks5 and wild-type root tips and in mature roots. Due to the buffering effect of water at alkaline pH, a series of recovery experiments was performed. Plant roots were treated at high pH (8.4) for 1 to 2 h. After roots adapted to alkaline conditions, the solution pH was changed from 8.4 to 5.8 (indicated by an arrow), and transient net H+ fluxes were recorded as plants tried to adapt to acidic conditions. (B) Net proton fluxes as a result of pretreatment with effectors of the PM H+-ATPase. (C) Membrane potential in response to external pH in pks5 and wild-type root tips and in mature roots.
Figure 5.
Figure 5.
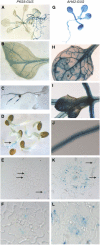
PKS5 and AHA2 Gene Expression Colocalizes in Arabidopsis. GUS staining of transgenic plants expressing PKS5:GUS in roots ([A] to [E]) and vascular tissues of leaves and stems ([A] and [B]). GUS staining of transgenic plants expressing AHA2:GUS in roots ([G], [J], and [K]) and vascular tissues of leaves and stems ([H] to [J]). Cross sections of roots ([E], [F], [K], and [L]) with ×100 magnifications ([F] and [L]). Arrows indicate staining of vascular tissue (E) and root hairs ([E] and [K]).
Figure 6.
Figure 6.
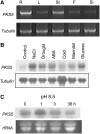
PKS5 Expression in Arabidopsis Is Regulated by Developmental and Environmental Conditions. (A) RT-PCR analysis of PKS5 in different plant tissues using tubulin as control. R, root; L, leaf; St, stem; F, flower; Si, silique. (B) and (C) RNA gel blot analysis of PKS5 in response to NaCl (300 mM for 3 h), drought (water content reduced by 30%), ABA (100 μM for 3 h), cold (0°C for 48 h), osmotic stress (300 mM mannitol for 3 h), glucose (300 mM for 3 h), or high external pH (C). Hybridization to a tubulin probe (B) or ethidium bromide staining of rRNA (C) was used as loading control.
Figure 7.
Figure 7.
PKS5 Is an Active Protein Kinase and Interacts with SCaBP1, and High External pH Triggers a Ca2+ Signal. (A) Evaluation of PKS5 autophosphorylation and phosphorylation of a peptide substrate. Following autophosphorylation assays, protein (100 ng per lane) was separated by SDS-PAGE, and the gel was stained with Coomassie blue (top panel) and exposed to x-ray film (middle panel). The ability of PKS5 to phosphorylate the peptide substrate p3 (400 pmol per assay) in the presence of different cofactors was determined (bottom panel). Data represents means ± sd; n = 3. (B) Interaction between SCaBP1 and PKS5 in a yeast two-hybrid assay. A yeast strain, Y190, transformed with the following constructs: pAS2-SCaBP1 and pACT2-PKS5 (lane 1); pAS2-SCaBP1 and pACT (lane 2); pACT-PKS5 and pAS2 (lane 3). Top panel, yeast growth; bottom panel, β-galactosidase activity. (C) SCaBP1 and PKS5 interact in vivo. Coimmunoprecipitation of Myc-tagged PKS5 and HA-tagged SCaBP1 protein from protoplasts. PKS5-Myc was immunoprecipitated using anti-Myc antibodies and the coprecipitated SCaBP1 protein detected by protein gel blotting using HA antibodies. Lane 1, protoplasts transformed with PKS5-Myc and SCaBP1-HA plasmid DNA; lane 2, as in lane 1, but protein extracted from half as many protoplasts; lane 3, protoplasts transformed only with PKS5-Myc. (D) SCaBP1 is a Ca2+ binding protein. GST-SCaBP1 fusion protein and GST were separated on 12.5% SDS-PAGE gels and blotted onto a nitrocellulose membrane, and the membrane was incubated with 45Ca2+. Left panel, Coomassie blue staining; right panel, Ca2+ binding. Lane 1, GST; lane 2, GST-SCaBP1. (E) High external pH elicits a cytosolic Ca2+ signal. Transgenic seedlings containing 35S:aequorin were grown on MS medium for 4 d. The seedlings were treated with 10 μM coelenterazine overnight. Seedlings were transferred to dishes that were divided into two parts: one with filter paper saturated with nutrient solution at pH 8.5 and another with pH 5.8. Bioluminescence images (middle panel) were taken immediately after transfer to media and quantified (bottom panel). Error bars represent means ± se of three replicate experiments.
Figure 8.
Figure 8.
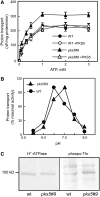
PKS5 Negatively Regulates the Activity of the PM H+-ATPase. (A) H+ transport (ΔpH formation) as a function of substrate (ATP). Data represent means ± se of at least three replicate experiments. Each replicate experiment was performed using independent membrane preparations from wild-type and pks5#9 plants grown at the same time. (B) Measurement of ΔpH formation as a function of pH at 3 mM ATP. One representative experiment of three replicates is shown; each replicate experiment was performed using independent membrane preparations. Reactions in (A) and (C) were initiated with the addition of 4 mM MgSO4. In (B), data are presented as percentage of control initial rate, which was set at 100% for activity at pH 6.5 and 7.0 for the wild type and pks5#9, respectively. (C) Protein blot of PM proteins from wild-type and pks5#9 plants probed with an anti-PM H+-ATPase antibody (left) or an antiphosphothreonine antibody (right).
Figure 9.
Figure 9.
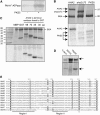
PKS5 Phosphorylates the PM H+-ATPase. (A) The H+-ATPase was pulled down from plasma membrane vesicles with polyclonal H+-ATPase antibodies and used in phosphorylation assays without (left lane) and with (right lane) PKS5 protein. (B) Deletion of 73 C-terminal amino acid residues eliminates PKS5 phosphorylation of the H+-ATPase AHA2. Coomassie blue–stained SDS gel (10%; top panel) and the corresponding phosphor image (bottom panel). Lane 1, AHA2 + PKS5; lane 2, aha2Δ73 + PKS5; lane 3, PKS5 alone (3× concentration as in lanes 1 and 2), PKS5 appears as a triple band. (C) PKS5 phosphorylates the C terminus of AHA2. Coomassie blue–stained gradient SDS gel (8 to 15%; top panel) and the corresponding phosphor image (bottom panel). Lane 1, molecular mass standards; lane 2, myelin basic protein (MBP); lane 3, GST; lane 4, GST C-terminal 98 amino acids (aa); lane 5, GST C-terminal 70 amino acids; lane 6, GST C-terminal 35 amino acids; and lane 7, GST-C-terminal 30 amino acids. (D) Phosphorylation of GST C-terminal AHA2 mutants. Coomassie blue–stained SDS gel (top panel) and the corresponding phosphor image (bottom panel). Lane 1, wild type; lane 2, T931A; and lane 3, S942A. (E) Alignment of the C termini of the PM H+-ATPases in Arabidopsis (AHA2 numbering). Ser or Thr residues reported to be phosphorylated are boxed with dark gray; conserved Ser and Thr residues are boxed with light gray. Ser-931, the site of AHA2 phosphorylation by PKS5, is conserved in the PM H+-ATPases in Arabidopsis (marked with an asterisk).
Figure 10.
Figure 10.
Together, PKS5 and SCaBP1 Inhibit the Activity of the PM H+-ATPase AHA2 When Expressed in Yeast by Reducing the Amount of 14-3-3 Protein Bound. (A) Drop tests were used as an indication of the activity of AHA2. The endogenous yeast PM H+-ATPase is only expressed when galactose is used as a carbon source, so the growth of the cells is dependent on the activity of AHA2 on glucose medium. The yeast cells harbor three plasmids expressing AHA2, PKS5, and SCaBP1 in different combinations (a to h). Cells were diluted in sterile water, and 8 μL was spotted at two concentrations (OD600 = 0.1 and 0.01) on selective media, pH 6.5. Gal, galactose; glu, glucose. The growth of the cells was monitored 3 to 6 d after transformation. (B) Mutation of Ser-931 in AHA2 abolishes the inhibition by PKS5 and SCaBP1. Drop test of yeast cells expressing AHA2 alone (a), AHA2 together with PKS5 and SCaBP1 (b), aha2S931A alone (c), or together with PKS5 and SCaBP1 (d). (C) Binding of 14-3-3 protein to the PM H+-ATPase is reduced when a charge is introduced at position 931 in aha2. Plasma membrane from yeast expressing different mutants of aha2 was subjected to SDS-PAGE and transferred to a nitrocellulose membrane. Top panel, 14-3-3 binding in an overlay assay; bottom panel, protein gel blot detecting the AHA2 C terminus. (D) Drop test demonstrating the yeast growth related to the amount of 14-3-3 protein bound to the PM H+-ATPase. As in (A), except that medium pH was 4.5 and yeast cells only harbored a single plasmid containing the H+-ATPase. (E) Overlay assay in which interaction between 14-3-3 proteins and PM H+-ATPase immobilized on a membrane cannot be abolished by a peptide derived from the C terminus of AHA2 if it is phosphorylated at Ser-931. 14-3-3 proteins were preincubated with peptides before use in the overlay assay. The peptides employed were all derived from the 24 C-terminal residues of AHA2 (residues 925 to 948) and contained one or two phosphoryl groups at the indicated positions. Unless indicated, unphosphorylated peptide was used.
Figure 11.
Figure 11.
Model for the Regulation of the PM H+-ATPase by Two Protein Kinases. When the PM H+-ATPase is phosphorylated at the very C terminus on Thr-947, the binding of a dimeric 14-3-3 protein results in activation of the pump. Each 14-3-3 protein binds the C-terminal tail of a PM H+-ATPase molecule, resulting in a complex between two 14-3-3 proteins and two closely associated C-terminal regions of the PM H+-ATPase (Ottmann et al., 2007). Following activation, the proton pump can be inactivated by either a protein phosphatase removing the phosphate group on Thr-947 (data not shown) or by the PKS5 protein kinase, which introduces a second phosphate group upstream in the C terminus at Ser-931. Due to steric and electrostatic hindrances, the complex between two 14-3-3 proteins and two PM H+-ATPases is not stable when Ser-931 is simultaneously phosphorylated on both PM H+-ATPase polypeptides. As a consequence, the binding of 14-3-3 protein to the PM H+-ATPase is blocked.

Similar articles

Cited by

References

    1. Axelsen, K.B., Venema, K., Jahn, T., Baunsgaard, L., and Palmgren, M.G. (1999). Molecular dissection of the C-terminal regulatory domain of the plant plasma membrane H+-ATPase AHA2: Mapping of residues that when altered give rise to an activated enzyme. Biochemistry 38 7227–7234. - PubMed
    1. Babourina, O., Leonova, T., Shabala, S., and Newman, I. (2000). Effect of sudden salt stress on ion fluxes in intact wheat suspension cells. Ann. Bot. (Lond.) 85 759–767.
    1. Buch-Pedersen, M.J., Venema, K., Serrano, R., and Palmgren, M.G. (2000). Abolishment of proton pumping and accumulation in the E1P conformational state of a plant plasma membrane H+-ATPase by substitution of a conserved aspartyl residue in transmembrane segment 6. J. Biol. Chem. 275 39167–39173. - PubMed
    1. Cheng, N.H., Pittman, J.K., Zhu, J.K., and Hirschi, K.D. (2004). The protein kinase SOS2 activates the Arabidopsis H+/Ca2+ antiporter CAX1 to integrate calcium transport and salt tolerance. J. Biol. Chem. 279 2922–2926. - PubMed
    1. Demidchik, V., Bowen, H.C., Maathuis, F.J.M., Shabala, S.N., Tester, M.A., White, P.J., and Davies, J.M. (2002). Arabidopsis thaliana root non-selective cation channels mediate calcium uptake and are involved in growth. Plant J. 32 799–808. - PubMed

Publication types

MeSH terms