

Identification of novel amplification gene targets in mouse and human breast cancer at a syntenic cluster mapping to mouse ch8A1 and human ch13q34
- PMID: 17483321
- PMCID: PMC4166497
- DOI: 10.1158/0008-5472.CAN-06-4672
Identification of novel amplification gene targets in mouse and human breast cancer at a syntenic cluster mapping to mouse ch8A1 and human ch13q34
Abstract
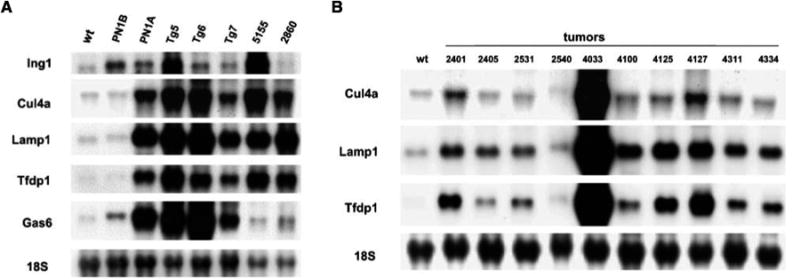
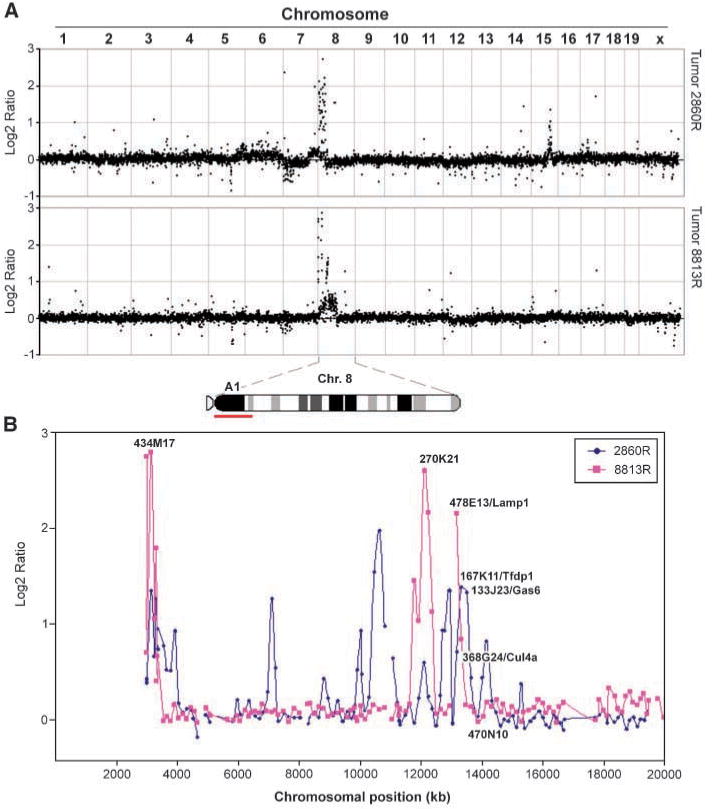
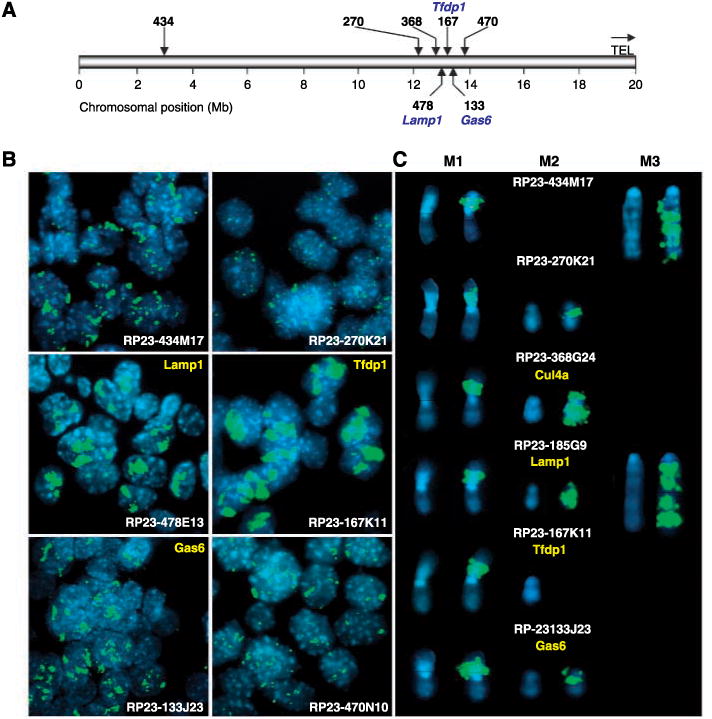
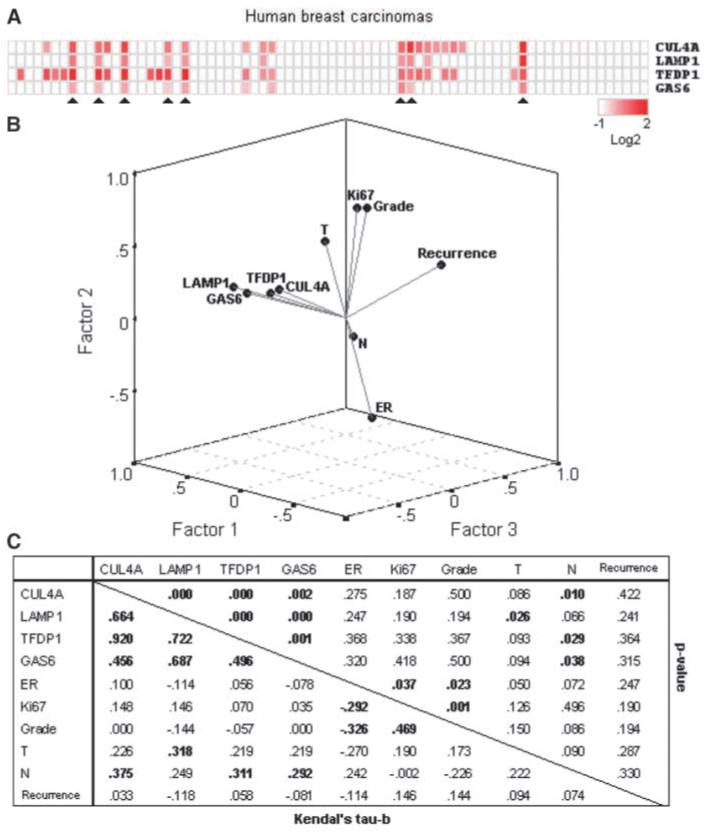
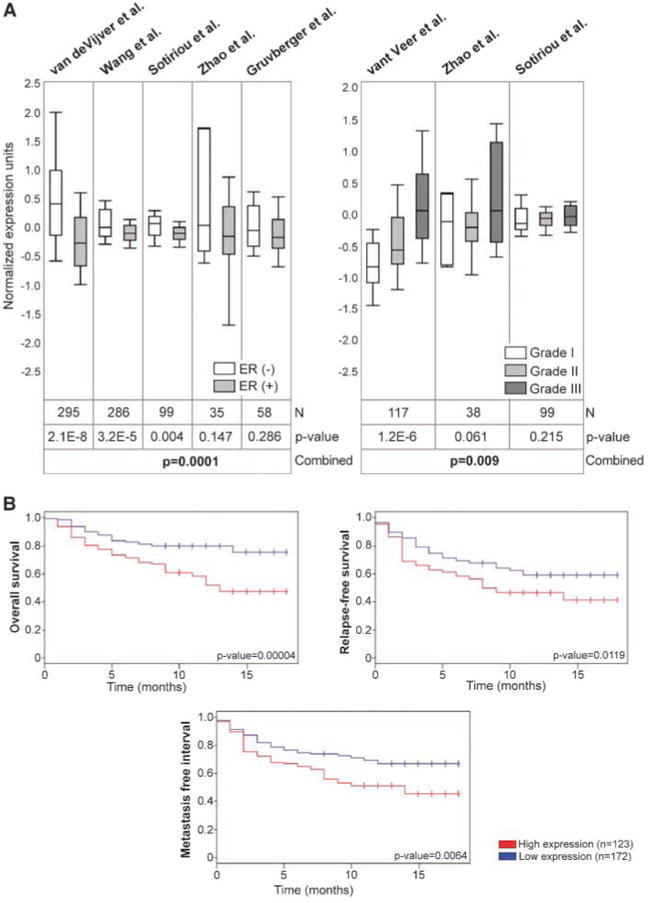
Serial analysis of gene expression from aggressive mammary tumors derived from transplantable p53 null mouse mammary outgrowth lines revealed significant up-regulation of Tfdp1 (transcription factor Dp1), Lamp1 (lysosomal membrane glycoprotein 1) and Gas6 (growth arrest specific 6) transcripts. All of these genes belong to the same linkage cluster, mapping to mouse chromosome band 8A1. BAC-array comparative genomic hybridization and fluorescence in situ hybridization analyses revealed genomic amplification at mouse region ch8A1.1. The minimal region of amplification contained genes Cul4a, Lamp1, Tfdp1, and Gas6, highly overexpressed in the p53 null mammary outgrowth lines at preneoplastic stages, and in all its derived tumors. The same amplification was also observed in spontaneous p53 null mammary tumors. Interestingly, this region is homologous to human chromosome 13q34, and some of the same genes were previously observed amplified in human carcinomas. Thus, we further investigated the occurrence and frequency of gene amplification affecting genes mapping to ch13q34 in human breast cancer. TFDP1 showed the highest frequency of amplification affecting 31% of 74 breast carcinomas analyzed. Statistically significant positive correlation was observed for the amplification of CUL4A, LAMP1, TFDP1, and GAS6 genes (P < 0.001). Meta-analysis of publicly available gene expression data sets showed a strong association between the high expression of TFDP1 and decreased overall survival (P = 0.00004), relapse-free survival (P = 0.0119), and metastasis-free interval (P = 0.0064). In conclusion, our findings suggest that CUL4A, LAMP1, TFDP1, and GAS6 are targets for overexpression and amplification in breast cancers. Therefore, overexpression of these genes and, in particular, TFDP1 might be of relevance in the development and/or progression in a significant subset of human breast carcinomas.
Figures
Similar articles
-
Comprehensive characterization of the DNA amplification at 13q34 in human breast cancer reveals TFDP1 and CUL4A as likely candidate target genes.Breast Cancer Res. 2009;11(6):R86. doi: 10.1186/bcr2456. Epub 2009 Dec 8. Breast Cancer Res. 2009. PMID: 19995430 Free PMC article.
-
TFDP1, CUL4A, and CDC16 identified as targets for amplification at 13q34 in hepatocellular carcinomas.Hepatology. 2002 Jun;35(6):1476-84. doi: 10.1053/jhep.2002.33683. Hepatology. 2002. PMID: 12029633
-
Gene amplification of the transcription factor DP1 and CTNND1 in human lung cancer.J Pathol. 2010 Sep;222(1):89-98. doi: 10.1002/path.2732. J Pathol. 2010. PMID: 20556744
-
Recurrent Amplification at 13q34 Targets at CUL4A, IRS2, and TFDP1 As an Independent Adverse Prognosticator in Intrahepatic Cholangiocarcinoma.PLoS One. 2015 Dec 18;10(12):e0145388. doi: 10.1371/journal.pone.0145388. eCollection 2015. PLoS One. 2015. PMID: 26684807 Free PMC article.
-
Genomic analyses as a guide to target identification and preclinical testing of mouse models of breast cancer.Toxicol Pathol. 2010 Jan;38(1):88-95. doi: 10.1177/0192623309357074. Epub 2010 Jan 15. Toxicol Pathol. 2010. PMID: 20080934 Free PMC article. Review.
Cited by
-
Identification of epigenetic modulators in human breast cancer by integrated analysis of DNA methylation and RNA-Seq data.Epigenetics. 2018;13(5):473-489. doi: 10.1080/15592294.2018.1469894. Epub 2018 Aug 7. Epigenetics. 2018. PMID: 29940789 Free PMC article.
-
Identification of disease-associated pathways in pancreatic cancer by integrating genome-wide association study and gene expression data.Oncol Lett. 2016 Jul;12(1):537-543. doi: 10.3892/ol.2016.4637. Epub 2016 May 26. Oncol Lett. 2016. PMID: 27347177 Free PMC article.
-
Cul4A overexpression associated with Gli1 expression in malignant pleural mesothelioma.J Cell Mol Med. 2015 Oct;19(10):2385-96. doi: 10.1111/jcmm.12620. Epub 2015 Jul 27. J Cell Mol Med. 2015. PMID: 26218750 Free PMC article.
-
Comprehensive characterization of the DNA amplification at 13q34 in human breast cancer reveals TFDP1 and CUL4A as likely candidate target genes.Breast Cancer Res. 2009;11(6):R86. doi: 10.1186/bcr2456. Epub 2009 Dec 8. Breast Cancer Res. 2009. PMID: 19995430 Free PMC article.
-
Diarylpentanoid (1,5-bis(4-hydroxy-3-methoxyphenyl)-1,4-pentadiene-3-one) (MS13) Exhibits Anti-proliferative, Apoptosis Induction and Anti-migration Properties on Androgen-independent Human Prostate Cancer by Targeting Cell Cycle-Apoptosis and PI3K Signalling Pathways.Front Pharmacol. 2021 Jul 20;12:707335. doi: 10.3389/fphar.2021.707335. eCollection 2021. Front Pharmacol. 2021. PMID: 34366863 Free PMC article.
References
-
- Jerry DJ, Kittrell FS, Kuperwasser C, et al. A mammary-specific model demonstrates the role of the p53 tumor suppressor gene in tumor development. Oncogene. 2000;19:1052–8. - PubMed
-
- Medina D, Kittrell FS. p53 function is required for hormone-mediated protection of mouse mammary tumorigenesis. Cancer Res. 2003;63:6140–3. - PubMed
-
- Medina D, Kittrell FS, Shepard A, et al. Biological and genetic properties of the p53 null preneoplastic mammary epithelium. FASEB J. 2002;16:881–3. - PubMed
-
- Aldaz CM, Hu Y, Daniel R, Gaddis S, Kittrell F, Medina D. Serial analysis of gene expression in normal p53 null mammary epithelium. Oncogene. 2002;21:6366–76. - PubMed
Publication types
MeSH terms
Substances
Grants and funding
LinkOut - more resources
Full Text Sources
Other Literature Sources
Medical
Molecular Biology Databases
Research Materials
Miscellaneous
