

doi: 10.1534/genetics.107.074203.
Epub 2007 May 4.
The evolution of condition-dependent sex in the face of high costs
Affiliations
- PMID: 17483405
- PMCID: PMC1931531
- DOI: 10.1534/genetics.107.074203
Item in Clipboard
The evolution of condition-dependent sex in the face of high costs
Genetics.
2007 Jul.
Abstract
Facultatively sexual organisms often engage in sex more often when in poor condition. We show that such condition-dependent sex carries evolutionary advantages and can explain the evolution of sexual reproduction even when sex entails high costs. Specifically, we show that alleles promoting individuals of low fitness to have sex more often than individuals of high fitness spread through a population. Such alleles are more likely to segregate out of bad genetic backgrounds and onto good genetic backgrounds, where they tend to remain. This "abandon-ship" mechanism provides a plausible model for the evolution and maintenance of facultative sex.
Figures
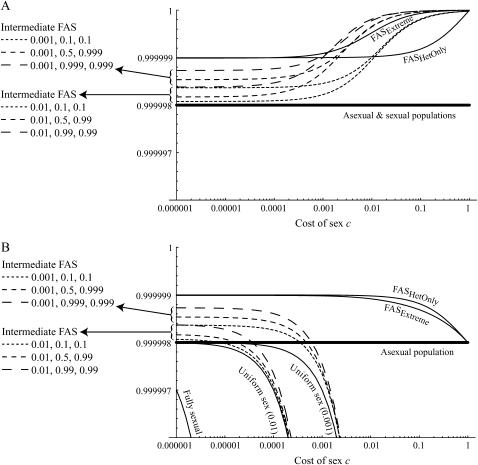
Mean fitness effects of FAS. The equilibrium of Equation 5 was determined numerically for μ = 10−6, s = 0.01, and h = 0.1 and used to calculate (A) the mean viability  (not including fitness cost of sex) and (B) the mean fitness
  (including fitness cost of sex) as a function of the per-locus cost of sex, c. Several sexual strategies were explored, including fully asexual, uniformly sexual (
 fixed for all genotypes at 0.001, 0.01, or 1), FASExtreme (
 ), FASHetOnly (
 ), and various intermediate FAS strategies. These FAS strategies always had a higher mean viability,
  , than asexual or uniformly sexual populations (the latter are nearly identical in mean viability). However, FAS strategies had a higher overall mean fitness,
  , than an asexual population only when the cost of sex was weak and/or no sex occurred in the most fit AA individuals (FASExtreme and FASHetOnly). Recall that c is the cost of sex per locus, so that values within the range of 10−5 and 10−3 are most plausible. Qualitatively similar results are observed for smaller or larger values of h.
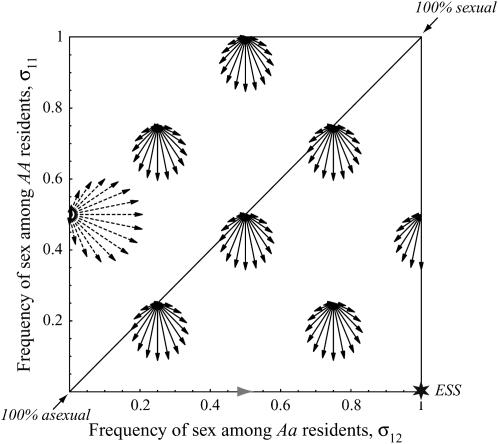
Evolutionarily favored transitions. According to Equation 10a, reproductive strategies are predicted to evolve in the directions shown. The axes represent the amount of sex among resident MMAA (vertical) and MMAa (horizontal) individuals (uniformly sexual populations lie on the diagonal). The direction of each arrow indicates the effect of a new modifier allele on the reproductive strategies of Mm individuals. The length of each arrow is proportional to the rate at which the modifier spreads. (The dashed arrows were reduced by 80% for clarity). Only modifier alleles that are able to invade are shown. Two types of evolutionary transitions toward FAS are favored: The system is strongly driven down toward no sex among AA individuals and more weakly to the right toward more sex among Aa individuals (assuming  ). The results are consistent with a numerical calculation of the eigenvalues [also used to derive the shaded arrowhead on the bottom, where equilibrium (6) and Equation 10 do not apply]. Over evolutionary time, the system is driven toward an ESS (star), where AA individuals are asexual and Aa individuals are fully sexual or as close as is biologically feasible. r = ½, hs = 0.001, c = 0.0001.
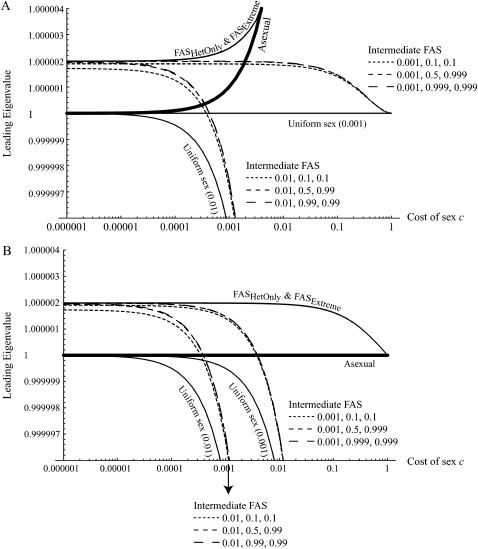
Invasion of FAS modifier alleles. The leading eigenvalue from a local stability analysis was calculated numerically for μ = 10−6, s = 0.01, h = 0.1, and r = ½ and plotted against the per-locus cost of sex (Equation 10 yields identical results). Whenever the leading eigenvalue is greater than one, the new modifier allele is able to invade. (A) The new modifier is introduced into a uniformly sexual resident population with  . (B) The new modifier is introduced into an asexual resident population with
  . Several modifier strategies were explored, each assuming that the modifier acted additively, with mm homozygotes inducing complete asexuality, uniform sexuality (0.001 or 0.01 of the time), FASExtreme (
 ), FASHetOnly (
 ), or intermediate FAS. FAS modifier alleles were able to invade sexual and asexual populations when the costs of sex were small. With higher costs of sex, FAS alleles were able to invade as long as the frequency of sex among AA individuals remained small. Recall that c is the cost of sex per locus, so that values within the range of 10−5 and 10−3 are most plausible.
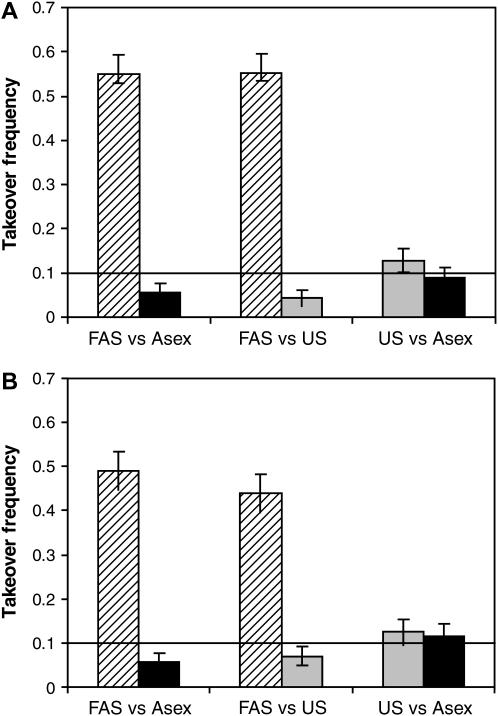
Invasion of modifier alleles with multiple fitness loci. Each column shows the takeover frequency of a certain modifier appearing within a population with a different modifier: Fitness-associated sex (FAS with σgood = 0.01, σpoor = 1.0) spreads to fixation in an asexual population (left, hatched bar), asexuality spreads in a FAS population (left, solid bar), FAS spreads in a uniformly sexual (US) population (middle, hatched bar), US spreads in a FAS population (middle, shaded bar), US spreads in an asexual population (right, shaded bar), and asexuality spreads in a US population (right, solid bar). In each case the introduced modifier started at 10% frequency, and the expected fixation rate of a neutral mutation is represented by the 0.1 line. (A) Sexual reproduction involves both segregation and recombination, where the genome is divided into five chromosomes with a single crossover on each; (B) sexual reproduction involves segregation without recombination (a single chromosome with r = 0). In each case, seven uniform strategies were tested: σu = 0.001, 0.01, 0.015, 0.02, 0.05, 0.1, and 1. The US strategy shown is the one that performed best against FAS (σu = 0.01 in A and σu = 0.015 in B). Parameters: C = ½, N = 2000, w* = 0.95, genomewide mutation rate = 0.05, with 1000 replicate simulations per bar (95% confidence intervals shown).
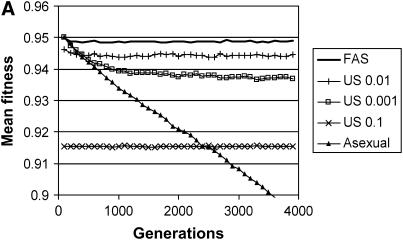
Long-term effects on mean fitness with multiple fitness loci. The mean fitness of the population is plotted as a function of time for four types of populations, each homogeneous for a different modifier: FAS (w* = 0.95, σgood = 0.01, σpoor = 1.0) and four uniform modifiers (σu = 0.0, 0.001, 0.01, 0.1). (A) Sexual reproduction involves both segregation and recombination, where the genome is divided into five chromosomes with a single crossover on each; (B) sexual reproduction involves segregation without recombination (a single chromosome with r = 0). Parameters: c = 0.5, N = 2000, genome mutation rate = 0.05, with each point representing an average of 100 runs. Mean fitness includes a twofold cost of sex, C = ½. Additional simulations with σu = 0.005, 0.015, 0.02, 0.05, and 1.0 are not plotted, but all these strategies resulted in significantly lower average fitness in comparison with σu = 0.01.
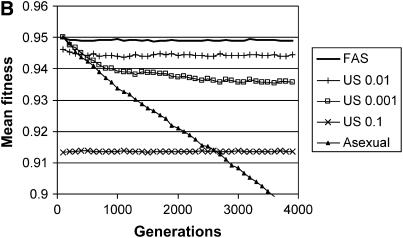
Long-term effects on mean fitness with multiple fitness loci. The mean fitness of the population is plotted as a function of time for four types of populations, each homogeneous for a different modifier: FAS (w* = 0.95, σgood = 0.01, σpoor = 1.0) and four uniform modifiers (σu = 0.0, 0.001, 0.01, 0.1). (A) Sexual reproduction involves both segregation and recombination, where the genome is divided into five chromosomes with a single crossover on each; (B) sexual reproduction involves segregation without recombination (a single chromosome with r = 0). Parameters: c = 0.5, N = 2000, genome mutation rate = 0.05, with each point representing an average of 100 runs. Mean fitness includes a twofold cost of sex, C = ½. Additional simulations with σu = 0.005, 0.015, 0.02, 0.05, and 1.0 are not plotted, but all these strategies resulted in significantly lower average fitness in comparison with σu = 0.01.
References
Publication types
MeSH terms
LinkOut - more resources
Full Text Sources
Research Materials
