

Genetic load in sexual and asexual diploids: segregation, dominance and genetic drift
- PMID: 17483409
- PMCID: PMC1931546
- DOI: 10.1534/genetics.107.073080
Genetic load in sexual and asexual diploids: segregation, dominance and genetic drift
Abstract
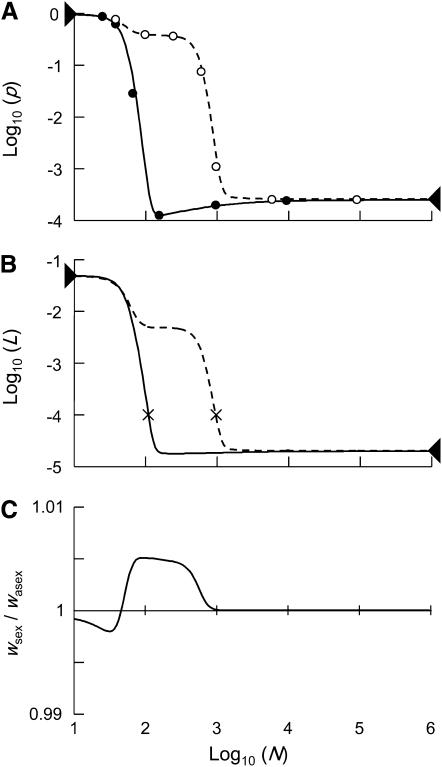
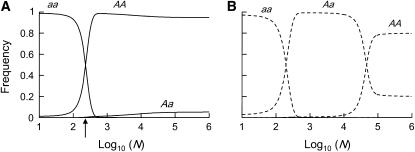
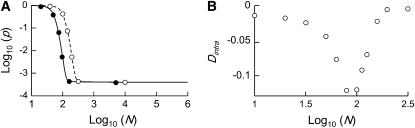
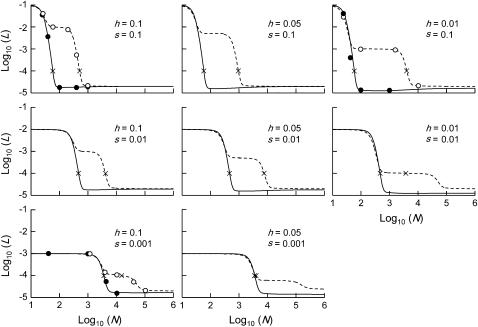
In diploid organisms, sexual reproduction rearranges allelic combinations between loci (recombination) as well as within loci (segregation). Several studies have analyzed the effect of segregation on the genetic load due to recurrent deleterious mutations, but considered infinite populations, thus neglecting the effects of genetic drift. Here, we use single-locus models to explore the combined effects of segregation, selection, and drift. We find that, for partly recessive deleterious alleles, segregation affects both the deterministic component of the change in allele frequencies and the stochastic component due to drift. As a result, we find that the mutation load may be far greater in asexuals than in sexuals in finite and/or subdivided populations. In finite populations, this effect arises primarily because, in the absence of segregation, heterozygotes may reach high frequencies due to drift, while homozygotes are still efficiently selected against; this is not possible with segregation, as matings between heterozygotes constantly produce new homozygotes. If deleterious alleles are partly, but not fully recessive, this causes an excess load in asexuals at intermediate population sizes. In subdivided populations without extinction, drift mostly occurs locally, which reduces the efficiency of selection in both sexuals and asexuals, but does not lead to global fixation. Yet, local drift is stronger in asexuals than in sexuals, leading to a higher mutation load in asexuals. In metapopulations with turnover, global drift becomes again important, leading to similar results as in finite, unstructured populations. Overall, the mutation load that arises through the absence of segregation in asexuals may greatly exceed previous predictions that ignored genetic drift.
Figures
Similar articles
-
Influences of dominance and evolution of sex in finite diploid populations.PLoS One. 2015 May 26;10(5):e0128459. doi: 10.1371/journal.pone.0128459. eCollection 2015. PLoS One. 2015. PMID: 26011082 Free PMC article.
-
Migration load and the coexistence of ecologically similar sexuals and asexuals.Am Nat. 2007 Oct;170(4):567-72. doi: 10.1086/521235. Epub 2007 Aug 8. Am Nat. 2007. PMID: 17891735
-
Diploidy and the selective advantage for sexual reproduction in unicellular organisms.Theory Biosci. 2009 Nov;128(4):249-85. doi: 10.1007/s12064-009-0077-9. Epub 2009 Nov 10. Theory Biosci. 2009. PMID: 19902285
-
Fixation of new alleles and the extinction of small populations: drift load, beneficial alleles, and sexual selection.Evolution. 2000 Dec;54(6):1855-61. doi: 10.1111/j.0014-3820.2000.tb01232.x. Evolution. 2000. PMID: 11209765 Review.
-
Mutation and the evolution of recombination.Philos Trans R Soc Lond B Biol Sci. 2010 Apr 27;365(1544):1281-94. doi: 10.1098/rstb.2009.0320. Philos Trans R Soc Lond B Biol Sci. 2010. PMID: 20308104 Free PMC article. Review.
Cited by
-
Synergy from reproductive division of labor and genetic complexity drive the evolution of sex.J Biol Phys. 2018 Sep;44(3):317-329. doi: 10.1007/s10867-018-9485-8. Epub 2018 Apr 16. J Biol Phys. 2018. PMID: 29663185 Free PMC article.
-
Influences of dominance and evolution of sex in finite diploid populations.PLoS One. 2015 May 26;10(5):e0128459. doi: 10.1371/journal.pone.0128459. eCollection 2015. PLoS One. 2015. PMID: 26011082 Free PMC article.
-
Genetic load: genomic estimates and applications in non-model animals.Nat Rev Genet. 2022 Aug;23(8):492-503. doi: 10.1038/s41576-022-00448-x. Epub 2022 Feb 8. Nat Rev Genet. 2022. PMID: 35136196 Review.
-
Asexual but Not Clonal: Evolutionary Processes in Automictic Populations.Genetics. 2017 Jun;206(2):993-1009. doi: 10.1534/genetics.116.196873. Epub 2017 Apr 4. Genetics. 2017. PMID: 28381586 Free PMC article.
-
Missing domesticated plant forms: can artificial selection fill the gap?Evol Appl. 2010 Sep;3(5-6):434-52. doi: 10.1111/j.1752-4571.2010.00132.x. Epub 2010 May 24. Evol Appl. 2010. PMID: 25567937 Free PMC article.
References
-
- Agrawal, A. F., 2006. Evolution of sex: why do organisms shuffle their genotypes. Curr. Biol. 16: R696–R704. - PubMed
Publication types
MeSH terms
LinkOut - more resources
Full Text Sources
Research Materials
