

Increasing the efficiency of variance component quantitative trait loci analysis by using reduced-rank identity-by-descent matrices
- PMID: 17483421
- PMCID: PMC1931556
- DOI: 10.1534/genetics.107.071977
Increasing the efficiency of variance component quantitative trait loci analysis by using reduced-rank identity-by-descent matrices
Abstract
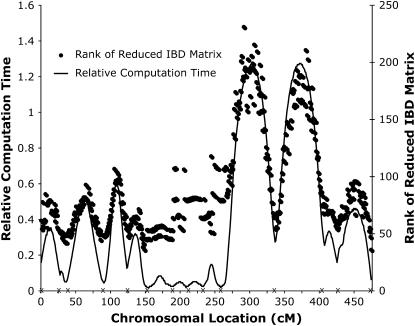
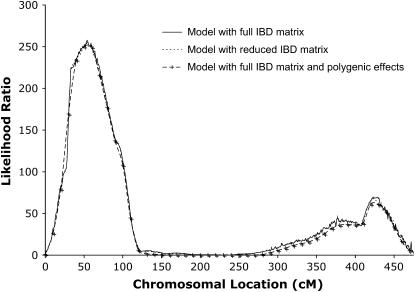
Recent technological development in genetics has made large-scale marker genotyping fast and practicable, facilitating studies for detection of QTL in large general pedigrees. We developed a method that speeds up restricted maximum-likelihood (REML) algorithms for QTL analysis by simplifying the inversion of the variance-covariance matrix of the trait vector. The method was tested in an experimental chicken pedigree including 767 phenotyped individuals and 14 genotyped markers on chicken chromosome 1. The computation time in a chromosome scan covering 475 cM was reduced by 43% when the analysis was based on linkage only and by 72% when linkage disequilibrium information was included. The relative advantage of using our method increases with pedigree size, marker density, and linkage disequilibrium, indicating even greater improvements in the future.
Figures
References
-
- Druet, T., and V. Ducrocq, 2006. Innovations in software packages in quantitative genetics. Paper no. 27-10. World Congress on Genetics Applied to Livestock Production, Belo Horizonte, Brazil.
-
- Gilmour, A. R., R. Thompson and B. R. Cullis, 1995. Average information REML: an efficient algorithm for variance parameter estimation in linear mixed models. Biometrics 51: 1440–1450.
-
- Golub, G. H., and C. Van Loan, 1996. Matrix Computations, Ed. 3. Johns Hopkins University Press, Baltimore.
-
- Heath, S. C., G. L. Snow, E. A. Thompson, C. Tseng and E. M. Wijsman, 1997. MCMC segregation and linkage analysis. Genet. Epidemiol. 14: 1011–1015. - PubMed
MeSH terms
Substances
LinkOut - more resources
Full Text Sources
