. 2007 Jul;176(3):1453-67.
doi: 10.1534/genetics.106.070235. Epub 2007 May 4.

Patterns of recombination and MLH1 foci density along mouse chromosomes: modeling effects of interference and obligate chiasma

Affiliations

Patterns of recombination and MLH1 foci density along mouse chromosomes: modeling effects of interference and obligate chiasma

M Falque et al. Genetics. 2007 Jul.

Abstract

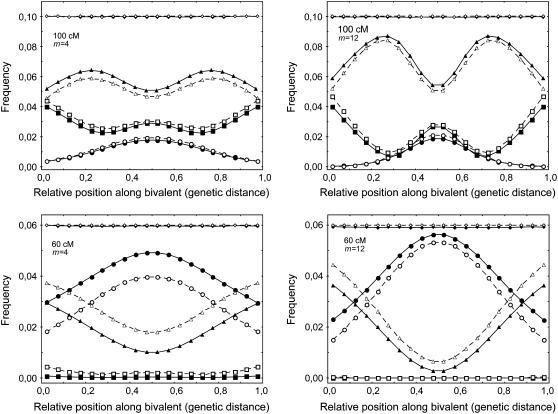
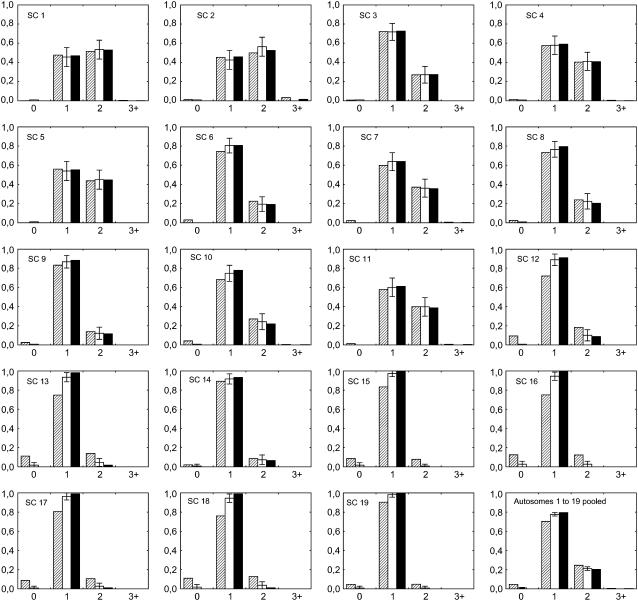
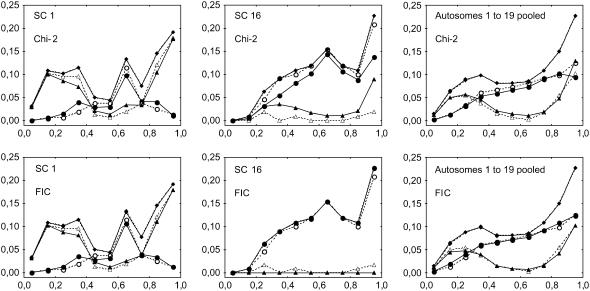
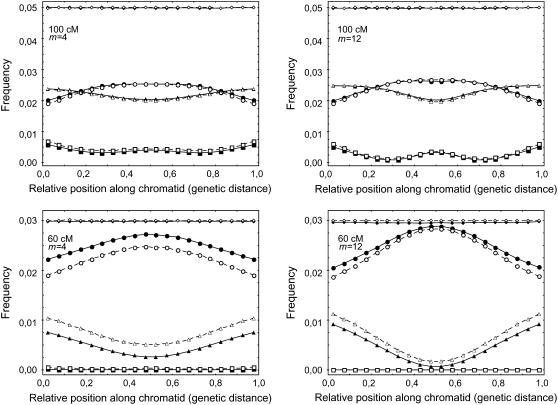
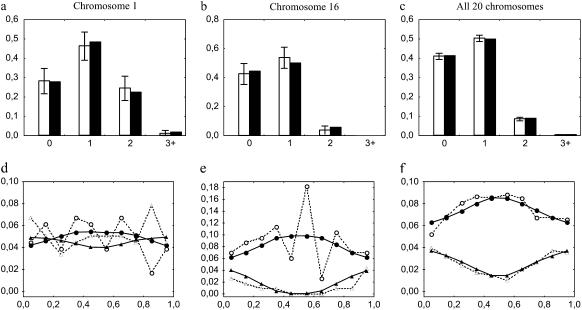
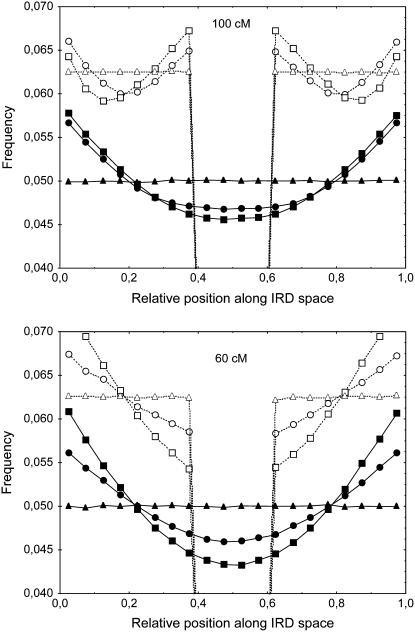
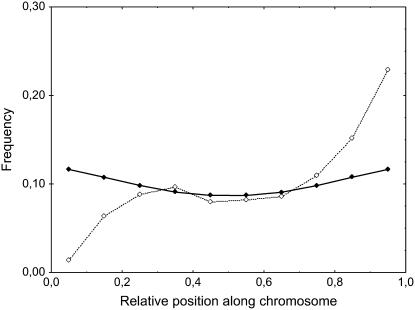
Crossover interference in meiosis is often modeled via stationary renewal processes. Here we consider a new model to incorporate the known biological feature of "obligate chiasma" whereby in most organisms each bivalent almost always has at least one crossover. The initial crossover is modeled as uniformly distributed along the chromosome, and starting from its position, subsequent crossovers are placed with forward and backward stationary renewal processes using a chi-square distribution of intercrossover distances. We used our model as well as the standard chi-square model to simulate the patterns of crossover densities along bivalents or chromatids for those having zero, one, two, or three or more crossovers; indeed, such patterns depend on the number of crossovers. With both models, simulated patterns compare very well to those found experimentally in mice, both for MLH1 foci on bivalents and for crossovers on genetic maps. However, our model provides a better fit to experimental data as compared to the standard chi-square model, particularly regarding the distribution of numbers of crossovers per chromosome. Finally, our model predicts an enhancement of the recombination rate near the extremities, which, however, explains only a part of the pattern observed in mouse.


Figures

F<sc>igure</sc> 1.—
Figure 1.—
Frequencies of crossovers (COs) along bivalents having one (circles), two (triangles), or three COs (squares) and for all bivalents (diamonds). Positions are based on genetic distances. The chromosome is taken to have a genetic size of 100 or 60 cM. The data were obtained from simulations using the standard chi-square model (open symbols and dashed lines) and our FIC model enforcing the obligate chiasma constraint (solid symbols and lines), using m = 4 and m = 12. x-axis: relative position of the middle of the bin along the synaptonemal complex (SC), expressed in relative genetic distance. All bin sizes are 0.05. CO frequencies are calculated from 5 × 10⁷ simulated meioses. The total curve for all bivalents is flat because of the definition of genetic distance.
F<sc>igure</sc> 2.—
Figure 2.—
Experimental and simulated frequencies of bivalents having zero, one, two, or three or more (x-axis) experimental MLH1 foci (open bars) or simulated COs (solid and dashed bars). Error bars indicate 95% confidence intervals (see text). Experimental data come from cytogenetical observations of MLH1 foci on male mice synaptonemal complexes (SCs) by Froenicke et al. (2002). Simulations are computed using the standard chi-square model (dashed bars) and our FIC model enforcing the obligate chiasma constraint (solid bars). Chromosome length (in morgans) is calculated as half the average number of MLH1 foci per bivalent in experimental data (see values in Table 1). The interference parameter m is adjusted for each chromosome on the basis of the distribution of inter-CO distances (see text; values in Table 1) and adjusted independently for the chi-square model and the FIC model. Frequencies are calculated for each autosome and in the last graph for all 19 autosomes pooled (see text). Simulated CO frequencies are calculated from 5 × 10⁵ simulated meioses.
F<sc>igure</sc> 3.—
Figure 3.—
Experimental and simulated frequencies of MLH1 foci along individual synaptonemal complexes (SCs) from centromere (left end) to telomere (right end), for bivalents having one (circles) or two (triangles) MLH1 and for all bivalents (diamonds). Experimental data (open symbols and dashed lines) come from cytogenetical observations of MLH1 foci on male mice bivalents by Froenicke et al. (2002). Simulations (solid symbols and lines) are computed using the chi-square model or our FIC model (see text). Chromosome length (in morgans) is calculated as half the average number of MLH1 foci per bivalent in experimental data (see values in Table 1). The interference parameter m is adjusted for each chromosome on the basis of the distribution of inter-CO distances (see text; values in Table 1) and adjusted independently for the chi-square model and the FIC model. x-axis: relative position of the middle of the bin along the synaptonemal complex (SC), expressed in relative SC distance. All bin sizes are 0.1. Frequencies are shown for chromosomes 1 (long) and 16 (short) and for all 19 autosomes pooled (see text). Graphs of other individual chromosomes are given in supplemental Figure 2 at http://www.genetics.org/supplemental/. All simulations are based on 5 × 10⁵ simulated meioses.
F<sc>igure</sc> 4.—
Figure 4.—
Simulated distribution of CO frequency along the genetic map for gametes having one, two, or three COs. Symbols and other elements are the same as described in the Figure 1 legend. Here, the model randomly suppresses on average half of the COs from the bivalents to go to the chromatid level.
F<sc>igure</sc> 5.—
Figure 5.—
Experimental and simulated distributions of COs. Experimental data come from mouse female meiosis analyzed via mapping experiments Broman et al. (2002). Simulations are computed using our FIC model. Values of genetic chromosome length (in morgans) and interference parameter m used for simulations are calculated from Broman et al. (2002) respectively as the average number of COs per gamete in experimental data and the estimated parameter ν of the gamma model − 1 (see values in Table 1). For chromosomes 17 and 18, where Broman found genetic lengths <50 cM, we use a length of 50 cM for simulations (see text). (a and d) Chromosome 1 (long); (b and e) chromosome 16 (short); (c and f) frequencies from pooled numbers of gametes or COs over all 20 chromosomes. Graphs of other individual chromosomes are given in supplemental Figure 3 at http://www.genetics.org/supplemental/. (a–c) Frequency of gametes with zero, one, two, and three or more COs (x-axis) in experimental and simulated data. Open bars indicate experimental data, and solid bars indicate simulated data. Error bars indicate 95% confidence intervals (see text). (d–f) Frequency distribution of COs along the genetic map, from centromere (left end) to telomere (right end) for gametes with exactly one (circles) or two (triangles) COs. x-axis: relative position of the middle of the bin along the genetic map. All bin sizes are 0.1. Open symbols and dashed lines indicate mouse experimental data. Solid symbols and lines indicate simulated data. Simulated CO frequencies are calculated from 5 × 10⁵ simulated meioses using our FIC model.
F<sc>igure</sc> 6.—
Figure 6.—
Simulated frequencies of COs along gametes. Positions are expressed in the interference-relevant distance (IRD) space (see text). The initial CO is uniformly distributed except for the curves with centromere effect. Genetic size of chromosome: 100 and 60 cM. Interference is modeled using our FIC model with interference parameter m. Triangles, m = 0; circles, m = 4; squares, m = 12, without centromere effect (solid symbols and lines) or with all recombination suppressed between positions 0.4 and 0.6 (centromere effect, open symbols and dashed lines). x-axis: relative position of the middle of the bin along the IRD space. All bin sizes are 0.05. CO frequencies are calculated from 5 × 10⁷ simulated meioses.
F<sc>igure</sc> 7.—
Figure 7.—
Experimental frequencies of mouse MLH1 foci along synaptonemal complexes (dashed line and open symbols) compared to simulated frequencies of crossovers (COs, solid line and symbols) under the hypothesis that IRD distance is the same as SC distance. MLH1 foci and simulated COs are first counted for each chromosome independently and then pooled. Experimental data come from cytologenetical observations of mouse chromosomes by Froenicke et al. (2002). Simulations are computed using our FIC model with obligate chiasma, without any centromere or telomere effect. Genetic sizes of the chromosomes and values of the interference parameter m for each chromosome are the same as in Figures 2 and 3. x-axis: classes of relative SC position along chromosome. Simulated CO frequencies are calculated from 5 × 10⁵ simulated meioses.

References

    1. Anderson, L. K., and S. M. Stack, 2005. Recombination nodules in plants. Cytogenet. Genome Res. 109: 198–204. - PubMed
    1. Argueso, J. L., J. Wanat, Z. Gemici and E. Alani, 2004. Competing crossover pathways act during meiosis in Saccharomyces cerevisiae. Genetics 168: 1805–1816. - PMC - PubMed
    1. Bishop, D. K., and D. Zickler, 2004. Early decision; meiotic crossover interference prior to stable strand exchange and synapsis. Cell 117: 9–15. - PubMed
    1. Broman, K. W., and J. L. Weber, 2000. Characterization of human crossover interference. Am. J. Hum. Genet. 66: 1911–1926. - PMC - PubMed
    1. Broman, K. W., L. B. Rowe, G. A. Churchill and K. Paigen, 2002. Crossover interference in the mouse. Genetics 160: 1123–1131. - PMC - PubMed