. 2007 May 8;104(19):7939-44.
doi: 10.1073/pnas.0702511104. Epub 2007 May 1.

Endosomal recycling controls plasma membrane area during mitosis

Affiliations

Endosomal recycling controls plasma membrane area during mitosis

Emmanuel Boucrot et al. Proc Natl Acad Sci U S A. .

Abstract

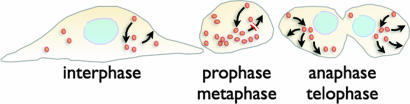
The shape and total surface of a cell and its daughters change during mitosis. Many cells round up during prophase and metaphase and reacquire their extended and flattened shape during cytokinesis. How does the total area of plasma membrane change to accommodate these morphological changes and by what mechanism is control of total membrane area achieved? Using single-cell imaging methods, we have found that the amount of plasma membrane in attached cells in culture decreases at the beginning of mitosis and recovers rapidly by the end. Clathrin-based endocytosis is normal throughout all phases of cell division, whereas recycling of internalized membranes back to the cell surface slows considerably during the rounding up period and resumes at the time at which recovery of cell membrane begins. Interference with either one of these processes by genetic or chemical means impairs cell division. The total cell-membrane area recovers even in the absence of a functional Golgi apparatus, which would be needed for export of newly synthesized membrane lipids and proteins. We propose a mechanism by which modulation of endosomal recycling controls cell area and surface expression of membrane-bound proteins during cell division.


Conflict of interest statement

The authors declare no conflict of interest.

Figures

Fig. 1.
Fig. 1.
Changes in cell shape and amount of plasma membrane during mitosis. (A) BSC1 cells visualized at several stages during the cell cycle, using bright field. N, nucleus. (B) BSC1 cells incubated for 2 min with FM 1-43 dye at 37°C and imaged at the same magnification at interphase, metaphase and cytokinesis. Three-dimensional image stacks were obtained from sequential optical sections acquired 0.25 μm apart by using the spinning disk confocal configuration. Shown is the fluorescence signal along the z axis (Upper) at its two dimensional projection (Lower). The integrated fluorescence, corrected for any fluorescence signal inside the cells, represents the amount of plasma membrane. Scale bar, 10 μm. (C) Amount of plasma membrane at different stages during the cell cycle was obtained in six experiments from 45 BSC1 and 64 HeLa cells, respectively. I, interphase; M, metaphase; C, cytokinesis. (D) Amount of plasma membrane in BSC1 cells, rounded up immediately after detachment by treatment with trypsin for 5 min at 37°C and then imaged as in B. Data from two experiments from nine trypsinized cells and six untreated control cells in interphase and spread on the coverslip.
Fig. 2.
Fig. 2.
Formation of clathrin coated pits and coated vesicles is not affected by mitosis. Live cell fluorescence imaging of AP-2, containing clathrin coated pits and coated vesicles located at the bottom surface of BSC1 cells. AP-2 was labeled by stable expression of σ2-adaptin fused to EGFP (17). Time series collected for 6 min and at 37°C from one cell during interphase, and from another cell sequentially imaged during metaphase and anaphase and ≈15 min into cytokinesis. The still images (Left) correspond to Middle and Bottom optical sections (scale bars, 10 and 5 μm, respectively) acquired after 3 min of data collection; the kymographs (Right) represent the complete time-series. The data are representative of experiments done in triplicate and were acquired every 2 s with 1-s exposures, using the spinning disk confocal configuration.
Fig. 3.
Fig. 3.
Receptor-mediated endocytosis of transferrin during cell division. The amounts of internalized transferrin (In) and of transferrin bound to the cell surface (Sur) were obtained by integration of their corresponding fluorescence signals present in the three-dimensional image stacks. The data (mean ± standard deviation) were obtained from 24, 18, 14, 5, and 20 cells imaged at interphase (I), prophase (P), metaphase (M), anaphase (A), and late stages of cytokinesis (C), respectively.
Fig. 4.
Fig. 4.
Exocytosis is required during cell division. (A) Surface distribution of transferrin receptor and Lamp-1 during interphase and cytokinesis. HeLa cells were processed for immunofluorescence at 4°C by incubation with antibodies specific for the luminal domain of the transferrin receptor (green) and of Lamp-1 (red), followed by fixation and addition of fluorescently tagged secondary antibodies (Alexa-647 and Alexa-594, respectively). Images acquired in the absence (control) or presence of overexpressed cytosolic forms of the EGFP-labeled v-soluble N-ethylmaleimide-sensitive factor attachment protein receptors (V-SNAREs) (VAMP3-DN or VAMP7-DN). The cells expressing these constructs were identified by the cytosol EGFP signal (data not shown). The control panel (cytokinesis) corresponds to two optical sections 2 μm apart. Cells in interphase contain little Lamp-1 at their cell surface and stain weakly for transferrin receptor. Some blebs present during cytokinesis (control) score positive for Lamp-1, whereas others are labeled with transferrin receptor; the overall transferrin receptor signal is significantly stronger when compared with cells in interphase. Short expression (4–6 h) of VAMP3-DN prevents the surface expression of transferrin receptor but not of Lamp-1 in cells undergoing telophase; in contrast, similar expression of VAMP7-DN prevents the surface appearance of Lamp-1 but not of transferrin receptor. DNA was labeled with DAPI (blue). Scale bar, 20 μm. (B) Normal function of VAMP3 and VAMP7 is required for completion of cytokinesis. Top panel (control): Images acquired by bright field illumination of a BSC1 cell starting with anaphase, continuing through cytokinesis and ending with the spreading and separation of the two daughter cells. Middle panel (VAMP3-DN): images (from SI Movie 11) of BSC1 cell expressing VAMP3-DN for 4–6 h before imaging; blebs are present, ingression of the cleavage furrow occurs but cells do not separate. Bottom panel (VAMP7-DN): images (from SI Movie 12) of BSC1 cell expressing VAMP7-DN for 4–6 h before imaging; blebs are absent, ingression of the cleavage furrow occurs, but cells do not separate. Scale bar, 20 μm.
Fig. 5.
Fig. 5.
Endocytosis is required for retrieval of plasma membrane during mitosis. BSC1 cells stably expressing EGFP-LCa were treated for 3 days with RNAi for μ2-adaptin to deplete AP-2 (center images) or for 30 min with 80 μM dynasore, a small molecule inhibitor of dynamin GTPase function (33) (rightmost image). These treatments inhibit clathrin-based endocytosis and during mitosis prevent cell rounding and loss of cell membrane (see SI Fig. 16B). Cells depleted of AP-2 and incubated for 5 min at 37°C with Alexa-594 transferrin (red) display surface staining, an almost complete absence of internalized transferrin, and the expected absence of endocytic clathrin coated pits and vesicles (EGFP-LCa, green). Because of the relative brief incubation with dynasore, these cells do not accumulate transferrin receptor at their surface even though receptor endocytosis is blocked; the punctate pattern of EGFP-LCa represents coated pits locked at the cell surface. A metaphase cell treated with only 0.8% DMSO (Ctrl) is shown. Whereas most control mitotic cells have normal spindles [decorated with EGFP-LCa, (53)], ≈50% of equivalent cells depleted of AP-2 or treated with dynasore display aberrant spindles (see SI Fig. 16A). Scale bar, 20 μm.
Fig. 6.
Fig. 6.
Model for membrane traffic during different stages of the cell cycle. The schematic representations highlight the changes in balance of membrane traffic between endocytic routes and secretory together with recycling pathways during key stages of the cell cycle. These pathways are balanced during interphase. During the rounding up occurring during prophase and metaphase, the amount of plasma membrane decreases because of the traffic imbalance arising from normal endocytosis combined with a considerable decrease in secretory and recycling traffic, creating an internal “membrane reservoir.” During anaphase, telophase and cytokinesis the amount of plasma membrane increases rapidly along with the appearance of surface blebs. Most of the plasma membrane is recovered by the rapid fusion of the previously stored endo-membranes with the cell surface. A Ca2+ signal is required to trigger the rapid fusion of endomembranes with the plasma membrane in what constitutes a form of regulated exocytosis. At this stage, the Golgi apparatus is barely reassembled, and hence secretory traffic is still minimal.

Similar articles

Cited by

References

    1. Meyers J, Craig J, Odde DJ. Curr Biol. 2006;16:1685–1693. - PubMed
    1. Ohnuma K, Yomo T, Asashima M, Kaneko K. Bioorg Med Chem Cell Biol. 2006;7:25. - PMC - PubMed
    1. Knutton S, Sumner MC, Pasternak CA. J Cell Biol. 1975;66:568–576. - PMC - PubMed
    1. Erickson CA, Trinkaus JP. Exp Cell Res. 1976;99:375–384. - PubMed
    1. Porter K, Prescott D, Frye J. J Cell Biol. 1973;57:815–836. - PMC - PubMed

Publication types