. 2007 May 8;104(19):7957-62.
doi: 10.1073/pnas.0700071104. Epub 2007 May 1.

The interplay between microRNAs and the neurotrophin receptor tropomyosin-related kinase C controls proliferation of human neuroblastoma cells

Affiliations

The interplay between microRNAs and the neurotrophin receptor tropomyosin-related kinase C controls proliferation of human neuroblastoma cells

Pietro Laneve et al. Proc Natl Acad Sci U S A. .

Abstract

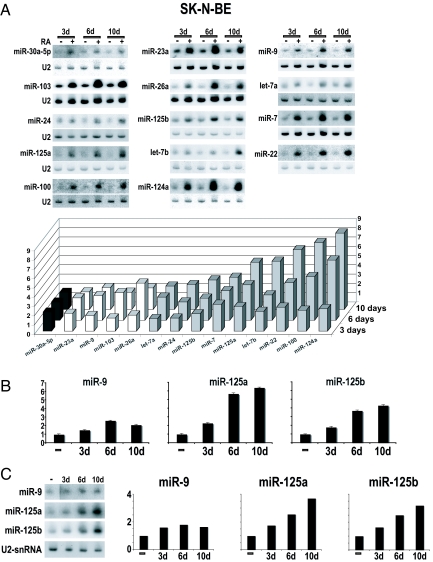
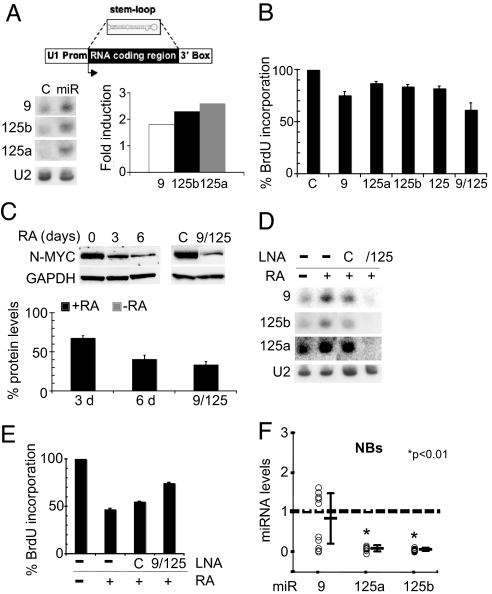
MicroRNAs (miRNAs) are tiny noncoding RNAs whose function as modulators of gene expression is crucial for the proper control of cell growth and differentiation. Although the profile of miRNA expression has been defined for many different cellular systems, the elucidation of the regulatory networks in which they are involved is only just emerging. In this work, we identify a crucial role for three neuronal miRNAs (9, 125a, and 125b) in controlling human neuroblastoma cell proliferation. We show that these molecules act in an additive manner by repressing a common target, the truncated isoform of the neurotrophin receptor tropomyosin-related kinase C, and we demonstrate that the down-regulation of this isoform is critical for regulating neuroblastoma cell growth. Consistently with their function, these miRNAs were found to be down-modulated in primary neuroblastoma tumors.


Conflict of interest statement

The authors declare no conflict of interest.

Figures

Fig. 1.
Fig. 1.
Expression profiles of miRNAs up-regulated in RA-treated SK-N-BE cells. (A) (Upper) Northern blots of the 14 miRNAs up-regulated in SK-N-BE cells upon RA treatment for 3 (lane 3d), 6 (lane 6d), or 10 (lane 10d) days. The probes are indicated on the left side of each panel; data were normalized to U2 snRNA hybridization signals. (Lower) The histogram depicts the distribution of the subsets of the 14 up-regulated miRNAs, clustered on the basis of their maximum induction times. Fold changes in miRNA expression are shown as the mean of the ratio of the RNA levels in RA-treated vs. untreated cells from three independent experiments. (B) RT-PCR quantification of miR-9, miR-125a, and miR-125b expression in SK-N-BE cells upon RA treatment for 3 (3d), 6 (6d), or 10 (10d) days. (C) Northern blots and histograms illustrating miRNA induction in KCNR NB cells, treated with RA for the same time points described in A and B. In B and C fold changes in miRNA expression are reported as the ratio of the RNA levels in RA-treated vs. untreated cells.
Fig. 2.
Fig. 2.
Overexpression and knockdown of miR-9, miR-125a, and miR-125b. (A) Northern blot of the ectopically expressed miRNAs (lanes miR); in lane C, RNA from cells transfected with the control plasmid was analyzed. In the upper part, a schematic representation of the construct expressing the miRNAs is reported. The histogram on the right shows the increased levels of miRNA expression: Fold induction was reported as the ratio of the RNA levels in cells transfected with the miRNAs relative to control cells. (B) The effect of miRNA overexpression on cell proliferation was evaluated by BrdU assay; values, reported as the percentage of BrdU incorporation in cells transfected with the miRNAs relative to control cells, are the means ± SD of three separate experiments. (C) Western blot analysis of N-Myc protein levels after RA treatment for 0 (lane 0), 3 (lane 3), and 6 (lane 6) days or after miRNA ectopic expression (lane 9/125) in SK-N-BE cells. In lane C, protein extracts from cells transfected with the control plasmid were analyzed. GAPDH protein levels were used as a loading control. The histogram below reports the N-Myc protein levels as the ratio between N-Myc values in RA-treated for 3 (3 d) or 6 (6 d) days vs. untreated cells or between cells overexpressing the miRNAs vs. control cells (9/125). (D) Northern blot of RNA from cells untreated (lane −) or treated with RA (lanes +) and transfected with a control LNA (lane C) or with anti-miR LNAs (lane 9/125). (E) The effect of miRNA knockdown on cell proliferation was assessed by evaluating the percentage of BrdU incorporation in RA-treated cells transfected with specific LNAs (9/125) or control LNA (C) relative to untreated cells. (F) Quantitative PCR of miR-9, miR-125a, and miR-125b levels in 10 primary human NBs. Expression levels are reported as fold changes relative to control tissue (dashed line). ∗, P < 0.01 vs. control RNA. In A and D, the probes are indicated on the left side of each panel; data were normalized to U2 snRNA hybridization signals.
Fig. 3.
Fig. 3.
Analysis of trkC expression in SK-N-BE cells. (A) Schematic representation of the trkC gene. The boxes represent the exons, continuous lines the introns; products of alternative splicing are depicted below, together with the target sites for the miRNAs. (B) Western blot analysis of the fl-trkC and t-trkC protein isoform levels from SK-N-BE cells treated with RA, for the times indicated above. GAPDH protein levels were used as a loading control. The histogram illustrates trkC protein levels, reported as arbitrary units (AU), in untreated (0) or RA-treated [3 (3 d), 6 (6 d), and 10 (10 d) days] SK-N-BE cells. The table summarizes the different truncated/full-length protein ratios in cells untreated (column C) or treated with RA (column RA).
Fig. 4.
Fig. 4.
Validation of trkC as a miRNA target (A) Schematic representation of the construct generated for the luciferase assay; binding sites for miR-9 and miR-125b on t-trkC 3′ UTR are indicated. The histogram reports the levels of luciferase activity in cells overexpressing the miRNAs indicated below and transfected with the wild-type 3′ UTR (3′ wt) or with its mutant derivative lacking the miRNA binding sites (3′ mut). (B) Western blot analysis of fl-trkC and t-trkC in cells overexpressing miR-9, miR-125a, and miR-125b (lane 9/125) or in control cells (lane C). The histogram depicts the fl-trkC and t-trkC levels in cells overexpressing the three miRNAs relative to control cells. (C) Western blot analysis of t-trkC protein after knockdown of miRNAs. Cells were untreated (lane −) or treated with RA (lanes +) and transfected with a control LNA (lane C) or with anti-miR LNAs (lane 9/125). The histogram reports the relative changes in t-trkC protein levels evaluated as the ratio of the protein in cells transfected with the anti-miRNA LNAs (9/125) or with the control LNA (C) relative to the untreated cells (−). (D) Western blot analysis of fl-trkC and t-trkC after specific silencing of the truncated isoform (lane αt-trkC). (E) The effect of t-trkC silencing on cell proliferation was evaluated by BrdU assay; values, reported as the percentage of BrdU incorporation in cells expressing the siRNAs relative to control cells, are the means ± SD of three separate experiments. (F) Western blot analysis of t-trkC overexpression (lane t-trkC) compared with control cells (lane C). (G) The effect of t-trkC overexpression on cell proliferation was evaluated by BrdU assay on RA-treated cells; values, reported as the percentage of BrdU incorporation in cells overexpressing the protein relative to control cells, are the means ± SD of three separate experiments. In B–D and F, GAPDH protein levels were evaluated as a loading control.
Fig. 5.
Fig. 5.
A model depicting the interplay between miRNAs and the t-trkC isoform in RA-induced neuronal differentiation. In undifferentiated SK-N-BE cells, the t-trkC protein level is 2-fold higher than that of the full-length isoform (Left). Upon RA treatment the overexpression of miRNAs causes a reduction of the truncated form, which correlates with a decrease in cell proliferation (Right).

Similar articles

Cited by

References

    1. Bartel DP. Cell. 2004;116:281–297. - PubMed
    1. Miska EA, Alvarez-Saavedra E, Townsend M, Yoshii A, Sestan N, Rakic P, Constantine-Paton M, Horvitz HR. Genome Biol. 2004;5:R68. - PMC - PubMed
    1. Smirnova L, Grafe A, Seiler A, Schumacher S, Nitsch R, Wulczyn FG. Eur J Neurosci. 2005;21:1469–1477. - PubMed
    1. Johnston RJ, Jr, Chang S, Etchberger JF, Ortiz CO, Hobert O. Proc Natl Acad Sci USA. 2005;102:12449–12454. - PMC - PubMed
    1. Giraldez AJ, Cinalli RM, Glasner ME, Enright AJ, Thomson JM, Baskerville S, Hammond SM, Bartel DP, Schier AF. Science. 2005;308:833–838. - PubMed

Publication types